Experian 2013 Annual Report Download - page 119
Download and view the complete annual report
Please find page 119 of the 2013 Experian annual report below. You can navigate through the pages in the report by either clicking on the pages listed below, or by using the keyword search tool below to find specific information within the annual report.-
 1
1 -
2
-
3
-
4
-
5
-
6
-
7
-
8
-
9
-
10
-
11
-
12
-
13
-
14
-
15
-
16
-
17
-
18
-
19
-
20
-
21
-
22
-
23
-
24
-
25
-
26
-
27
-
28
-
29
-
30
-
31
-
32
-
33
-
34
-
35
-
36
-
37
-
38
-
39
-
40
-
41
-
42
-
43
-
44
-
45
-
46
-
47
-
48
-
49
-
50
-
51
-
52
-
53
-
54
-
55
-
56
-
57
-
58
-
59
-
60
-
61
-
62
-
63
-
64
-
65
-
66
-
67
-
68
-
69
-
70
-
71
-
72
-
73
-
74
-
75
-
76
-
77
-
78
-
79
-
80
-
81
-
82
-
83
-
84
-
85
-
86
-
87
-
88
-
89
-
90
-
91
-
92
-
93
-
94
-
95
-
96
-
97
-
98
-
99
-
100
-
101
-
102
-
103
-
104
-
105
-
106
-
107
-
108
-
 109
109 -
 110
110 -
 111
111 -
 112
112 -
 113
113 -
 114
114 -
 115
115 -
 116
116 -
 117
117 -
 118
118 -
 119
119 -
 120
120 -
 121
121 -
 122
122 -
 123
123 -
 124
124 -
 125
125 -
 126
126 -
 127
127 -
 128
128 -
 129
129 -
130
-
131
-
132
-
133
-
134
-
135
-
136
-
137
-
138
-
139
-
140
-
141
-
142
-
143
-
144
-
145
-
146
-
147
-
148
-
149
-
150
-
151
-
152
-
153
-
154
-
155
-
156
-
157
-
158
-
159
-
160
-
161
-
162
-
163
-
164
-
165
-
166
-
167
-
168
-
169
-
170
-
171
-
172
-
173
-
174
-
175
-
176
 |
 |

117
Business review Business overview Governance Financial statements
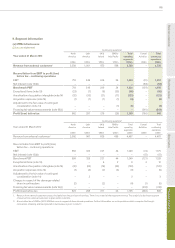
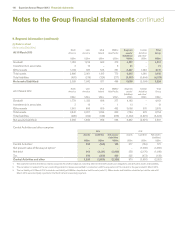
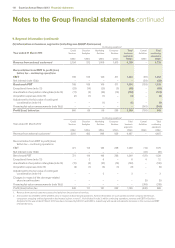
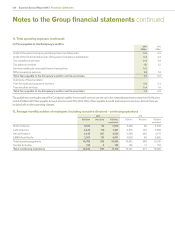
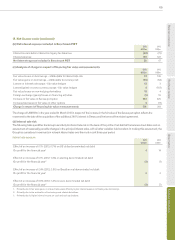
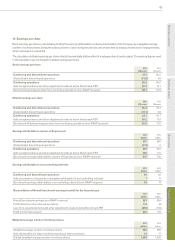
9. Segment information (continued)
Capital employed
2013
US$m
2012
US$m
North America 2,399 2,356
Latin America 1,842 1,983
UK and Ireland 871 958
EMEA/Asia Pacific 496 555
Total operating segments 5,608 5,852
Central Activities 125 127
Total Group 5,733 5,979
(iii) Capital expenditure, depreciation and amortisation
Capital expenditure Depreciation Amortisation
2013
US$m
2012
US$m
2013
US$m
2012
US$m
2013
US$m
2012
US$m
North America 181 159 36 31 97 96
Latin America 116 141 15 16 69 66
UK and Ireland 78 74 18 16 33 33
EMEA/Asia Pacific 58 60 10 10 34 32
Total operating segments 433 434 79 73 233 227
Central Activities 27 30 2 2 15 8
460 464 81 75 248 235
1. Capital expenditure is stated before receipts in the form of landlord incentives (see note 44(j)).
2. Depreciation and amortisation within the above analysis only include amounts charged to Benchmark PBT.
3. Additional capital expenditure of US$nil (2012: US$3m), depreciation of US$nil (2012: US$4m) and amortisation of US$nil (2012: US$2m) arose in respect of
discontinued operations in the North America segment. Further information on such operations is given in note 17.
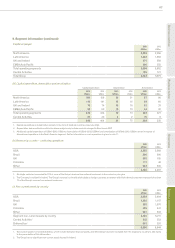
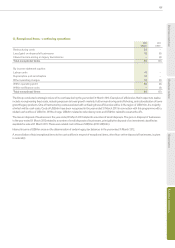
(iv) Revenue by country – continuing operations
2013
US$m
2012
US$m
USA 2,255 2,089
Brazil 866 900
UK 865 815
Colombia 111 48
Other 633 635
4,730 4,487
1. No single customer accounted for 10% or more of the Group’s revenue from external customers in the current or prior year.
2. The Company is resident in Ireland. The Group’s revenue is primarily attributable to foreign countries as revenue with Irish external customers represents less than
1% of the Group’s revenue from external customers.
(v) Non-current assets by country
2013
US$m
2012
US$m
USA 2,638 2,494
Brazil 1,450 1,617
UK 985 1,070
Colombia 425 447
Other 607 643
Segment non-current assets by country 6,105 6,271
Central Activities1212 253
Deferred tax1643 320
6,960 6,844
1. Non-current assets for Central Activities, which include derivative financial assets, and deferred tax have been excluded from the analysis by country to add clarity
to the presentation of this information.
2. The Group has no significant non-current assets located in Ireland.