Experian 2013 Annual Report Download - page 125
Download and view the complete annual report
Please find page 125 of the 2013 Experian annual report below. You can navigate through the pages in the report by either clicking on the pages listed below, or by using the keyword search tool below to find specific information within the annual report.-
 1
1 -
2
-
3
-
4
-
5
-
6
-
7
-
8
-
9
-
10
-
11
-
12
-
13
-
14
-
15
-
16
-
17
-
18
-
19
-
20
-
21
-
22
-
23
-
24
-
25
-
26
-
27
-
28
-
29
-
30
-
31
-
32
-
33
-
34
-
35
-
36
-
37
-
38
-
39
-
40
-
41
-
42
-
43
-
44
-
45
-
46
-
47
-
48
-
49
-
50
-
51
-
52
-
53
-
54
-
55
-
56
-
57
-
58
-
59
-
60
-
61
-
62
-
63
-
64
-
65
-
66
-
67
-
68
-
69
-
70
-
71
-
72
-
73
-
74
-
75
-
76
-
77
-
78
-
79
-
80
-
81
-
82
-
83
-
84
-
85
-
86
-
87
-
88
-
89
-
90
-
91
-
92
-
93
-
94
-
95
-
96
-
97
-
98
-
99
-
100
-
101
-
102
-
103
-
104
-
105
-
106
-
107
-
108
-
109
-
110
-
111
-
112
-
113
-
114
-
 115
115 -
 116
116 -
 117
117 -
 118
118 -
 119
119 -
 120
120 -
 121
121 -
 122
122 -
 123
123 -
 124
124 -
 125
125 -
 126
126 -
 127
127 -
 128
128 -
 129
129 -
 130
130 -
 131
131 -
 132
132 -
 133
133 -
 134
134 -
 135
135 -
136
-
137
-
138
-
139
-
140
-
141
-
142
-
143
-
144
-
145
-
146
-
147
-
148
-
149
-
150
-
151
-
152
-
153
-
154
-
155
-
156
-
157
-
158
-
159
-
160
-
161
-
162
-
163
-
164
-
165
-
166
-
167
-
168
-
169
-
170
-
171
-
172
-
173
-
174
-
175
-
176
 |
 |

123
Business review Business overview Governance Financial statements
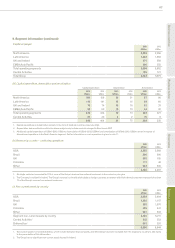
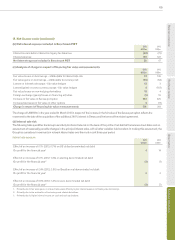
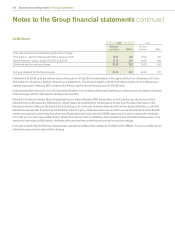
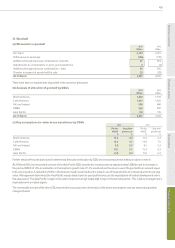
15. Net finance costs (continued)
(b) Net interest expense included in Benchmark PBT
2013
US$m
2012
US$m
Interest income before interest on legacy tax balances (68) (75)
Interest expense 126 122
Net interest expense included in Benchmark PBT 58 47
(c) Analysis of charge in respect of financing fair value remeasurements
2013
US$m
2012
US$m
Fair value losses on borrowings – attributable to interest rate risk 32 135
Fair value gains on borrowings – attributable to currency risk (60) (53)
Losses on interest rate swaps – fair value hedges 12 3
Losses/(gains) on cross currency swaps – fair value hedges 9 (101)
Fair value losses on non-hedging derivatives 10 4
Foreign exchange (gains)/losses on financing activities (5) 16
Increase in fair value of Serasa put option 558 325
Increase/(decrease) in fair value of other options 5 (11)
Charge in respect of financing fair value remeasurements 561 318
The charge of US$558m in the year ended 31 March 2013 in respect of the increase in the fair value of the Serasa put option reflects the
movement to the date of the acquisition of the additional 29.6% interest in Serasa and the terms of the related agreement.
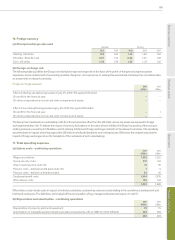
(d) Interest rate risk
The following table quantifies the Group’s sensitivity to interest rate risk on the basis of the profile of net debt at the balance sheet dates and an
assessment of reasonably possible changes in the principal interest rates, with all other variables held constant. In making this assessment, the
Group has considered movements in relevant interest rates over the most recent three-year period.
Interest rate exposure
2013
US$m
2012
US$m
Effect of an increase of 0.1% (2012: 0.7%) on US dollar denominated net debt:
On profit for the financial year14 14
Effect of an increase of 0.1% (2012: 1.4%) on sterling denominated net debt:
On profit for the financial year2(3) (1)
Effect of an increase of 2.4% (2012: 2.3%) on Brazilian real denominated net debt:
On profit for the financial year32 3
Effect of an increase of 0.6% (2012: 1.4%) on euro denominated net debt:
On profit for the financial year2(3) (7)
1. Primarily due to fair value gains on interest rate swaps offset by higher interest expense on floating rate borrowings.
2. Primarily due to the revaluation of borrowings and related derivatives.
3. Primarily due to higher interest income on cash and cash equivalents.