Experian 2013 Annual Report Download - page 36
Download and view the complete annual report
Please find page 36 of the 2013 Experian annual report below. You can navigate through the pages in the report by either clicking on the pages listed below, or by using the keyword search tool below to find specific information within the annual report.-
 1
1 -
2
-
3
-
4
-
5
-
6
-
7
-
8
-
9
-
10
-
11
-
12
-
13
-
14
-
15
-
16
-
17
-
18
-
19
-
20
-
21
-
22
-
23
-
24
-
25
-
 26
26 -
 27
27 -
 28
28 -
 29
29 -
 30
30 -
 31
31 -
 32
32 -
 33
33 -
 34
34 -
 35
35 -
 36
36 -
 37
37 -
 38
38 -
 39
39 -
 40
40 -
 41
41 -
 42
42 -
 43
43 -
 44
44 -
 45
45 -
 46
46 -
47
-
48
-
49
-
50
-
51
-
52
-
53
-
54
-
55
-
56
-
57
-
58
-
59
-
60
-
61
-
62
-
63
-
64
-
65
-
66
-
67
-
68
-
69
-
70
-
71
-
72
-
73
-
74
-
75
-
76
-
77
-
78
-
79
-
80
-
81
-
82
-
83
-
84
-
85
-
86
-
87
-
88
-
89
-
90
-
91
-
92
-
93
-
94
-
95
-
96
-
97
-
98
-
99
-
100
-
101
-
102
-
103
-
104
-
105
-
106
-
107
-
108
-
109
-
110
-
111
-
112
-
113
-
114
-
115
-
116
-
117
-
118
-
119
-
120
-
121
-
122
-
123
-
124
-
125
-
126
-
127
-
128
-
129
-
130
-
131
-
132
-
133
-
134
-
135
-
136
-
137
-
138
-
139
-
140
-
141
-
142
-
143
-
144
-
145
-
146
-
147
-
148
-
149
-
150
-
151
-
152
-
153
-
154
-
155
-
156
-
157
-
158
-
159
-
160
-
161
-
162
-
163
-
164
-
165
-
166
-
167
-
168
-
169
-
170
-
171
-
172
-
173
-
174
-
175
-
176
 |
 |

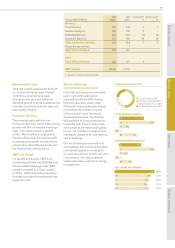
Chief Executive’s review continued
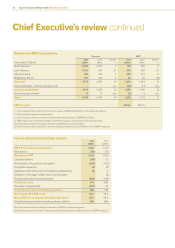
Revenue and EBIT by geography
Revenue EBIT
Year ended 31 March
2013
US$m
20121
US$m
Growth2
%
2013
US$m
20121
US$m
Growth2
%
North America 2,258 2,092 8 718 658 9
Latin America 1,001 961 21 346 320 27
UK and Ireland 873 824 7 246 227 9
EMEA/Asia Pacific 581 579 4 26 38 (18)
Sub total 4,713 4,456 10 1,336 1,243 13
Central Activities - central corporate costs ––n/a(81) (74) n/a
Continuing activities 4,713 4,456 10 1,255 1,169 13
Discontinuing activities317 31 n/a (2) 6n/a
Tot al 4,730 4,487 10 1,253 1,175 12
EBIT margin426.6% 26.2%
1. 2012 restated for the movement of some businesses in EMEA/Asia Pacific to discontinuing activities.
2. Total growth at constant exchange rates.
3. Discontinuing activities comprise small discontinuing businesses in EMEA/Asia Pacific.
4. EBIT margin is for continuing activities only. Further analysis can be found in the financial review.
See the financial review for analysis of revenue and EBIT by business segment.
See the financial review and note 7 to the Group financial statements for definitions of non-GAAP measures.
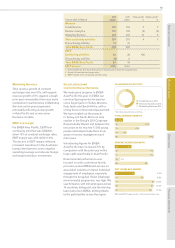
Income statement and earnings analysis
2013
US$m
2012
US$m
EBIT from continuing operations 1,253 1,175
Net interest (58) (47)
Benchmark PBT 1,195 1,128
Exceptional items (66) 12
Amortisation of acquisition intangibles (123) (122)
Acquisition expenses (4) (9)
Adjustment to the fair value of contingent consideration (1) 3
Charges for demerger-related share incentive plans –(5)
Financing fair value remeasurements (561) (318)
Profit before tax 440 689
Group tax (charge)/credit (152) 35
Profit after tax from continuing operations 288 724
Benchmark EPS (US cents) 85.7 78.9
Basic EPS for continuing operations (US cents) 25.2 66.8
Weighted average number of ordinary shares (million) 988 989
See the financial review for analysis of revenue and EBIT by business segment.
See the financial review and note 7 to the Group financial statements for definitions of non-GAAP measures.
34 Experian Annual Report 2013 Business review