Experian 2013 Annual Report Download - page 27
Download and view the complete annual report
Please find page 27 of the 2013 Experian annual report below. You can navigate through the pages in the report by either clicking on the pages listed below, or by using the keyword search tool below to find specific information within the annual report.-
 1
1 -
2
-
3
-
4
-
5
-
6
-
7
-
8
-
9
-
10
-
11
-
12
-
13
-
14
-
15
-
16
-
 17
17 -
 18
18 -
 19
19 -
 20
20 -
 21
21 -
 22
22 -
 23
23 -
 24
24 -
 25
25 -
 26
26 -
 27
27 -
 28
28 -
 29
29 -
 30
30 -
 31
31 -
 32
32 -
 33
33 -
 34
34 -
 35
35 -
 36
36 -
 37
37 -
38
-
39
-
40
-
41
-
42
-
43
-
44
-
45
-
46
-
47
-
48
-
49
-
50
-
51
-
52
-
53
-
54
-
55
-
56
-
57
-
58
-
59
-
60
-
61
-
62
-
63
-
64
-
65
-
66
-
67
-
68
-
69
-
70
-
71
-
72
-
73
-
74
-
75
-
76
-
77
-
78
-
79
-
80
-
81
-
82
-
83
-
84
-
85
-
86
-
87
-
88
-
89
-
90
-
91
-
92
-
93
-
94
-
95
-
96
-
97
-
98
-
99
-
100
-
101
-
102
-
103
-
104
-
105
-
106
-
107
-
108
-
109
-
110
-
111
-
112
-
113
-
114
-
115
-
116
-
117
-
118
-
119
-
120
-
121
-
122
-
123
-
124
-
125
-
126
-
127
-
128
-
129
-
130
-
131
-
132
-
133
-
134
-
135
-
136
-
137
-
138
-
139
-
140
-
141
-
142
-
143
-
144
-
145
-
146
-
147
-
148
-
149
-
150
-
151
-
152
-
153
-
154
-
155
-
156
-
157
-
158
-
159
-
160
-
161
-
162
-
163
-
164
-
165
-
166
-
167
-
168
-
169
-
170
-
171
-
172
-
173
-
174
-
175
-
176
 |
 |

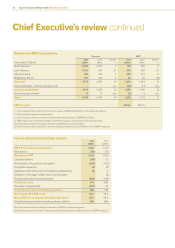
10 72%
OTHER KEY PERFORMANCE INDICATORS
Percentage of revenue from Latin
America and EMEA/Asia Pacific
We look to extend our geographical
reach beyond our traditional markets of
the US and UK, and expand further into
Latin America and EMEA/Asia Pacific.
This year revenue from the latter
decreased to 33% of global revenue
due to growth in the US and UK, and
depreciation of the Brazilian real.
Revenue dependence on top 20 clients
(percentage of total revenue)
We aim to reduce our reliance on any
single client in order to increase the
balance and diversity of our revenue
base. Revenue from our top 20 clients
now stands at 15% of total revenue.
2012 restated for the movement of some businesses in
EMEA/Asia Pacific to discontinuing activities.
2012 restated for the movement of some businesses in
EMEA/Asia Pacific to discontinuing activities.
Carbon footprint (000’s tonnes)
Our environmental impact is largely the result of energy use in our offices and data
centres, and from employee travel. We remain committed to reducing our impact
on the environment and we have policies and strategies in place to ensure that
we steadily reduce our energy consumption and increase the use of energy from
renewable sources. Employee engagement was a particular focus this year, with
a series of initiatives designed to encourage individually responsible behaviour.
Whilst total carbon emissions across the Group remained at 80,000 tonnes for the
year ended 31 March 2013, CO2 per employee and per US$1,000 of revenue have
decreased to 4.6 tonnes and 16.8 kilograms respectively.
See the full corporate responsibility report for details,
calculation methods and further information on how
Experian is minimising its impact on the environment at
www.experianplc.com/crreport.
Where emission factors have changed Experian has
applied the most recent factors retrospectively.
2012 restated to remove emissions related to a building
in North America on a long-term lease to a third party.
Building emissions were previously reported as
56,000 tonnes.
Employee engagement
We conduct an all-employee global
people survey every 18 months to
gather feedback from employees and
to measure their engagement with the
business. The results are analysed in-
depth and used to develop action plans
that deliver sustainable improvements.
Our last full survey, conducted in 2011,
showed that employee engagement
improved three percentage points in
2011 to 9% below the Towers Watson
Global High Performance Companies
Norm¹ benchmark. In-between the full
surveys, we conduct a shortened ‘pulse’
survey to gauge whether our efforts
in improving the work environment
through our action plans are on the right
track; please refer to the our people
section for further information. Our
next full survey takes place in May 2013,
with the results to be included in next year’s
annual report.
1. The Towers Watson Global High Performance
Companies Norm is based on over 500,000 employees’
survey results from a cross section of 28 companies.
Companies qualifying for this norm meet two criteria:
superior financial performance and superior human
resources practices.
Please refer to the our people section for further information.
Number of credit bureaux
Our credit bureaux, which hold and
manage the credit application and
repayment histories on consumers and
businesses, are the foundation of our
consumer and business information
activities in Credit Services. We own
18 consumer and 12 business credit
bureaux, and further operate one
consumer and one business bureau.
In the year ended 31 March 2013 we
divested a business bureau in Italy.
Please refer to the Credit Services section for further
information on credit bureaux.
Experian Group employee engagement
Towers Watson Global High Performance
Companies Norm1
11 75%
84%
84%
Percentage of revenue from
customer segments other than
financial services
We are increasing our penetration
into new customer segments, beyond
financial services, into areas such as
healthcare payments, insurance, public
sector, SME, telecommunications
and utilities. We now generate 70% of
revenue from non-financial verticals.
00.016.8 4.6
20.2 5.3
00.020.1 5.3
00.018.4 5.3
00.017.7 5.0
Buildings
Travel
CO2 emission per
US$1,000 of revenue
(kilograms)
CO2 emission per
full time equivalent
employee (tonnes)
10
11
12
09
13
10
11
12
09
13
10
11
12
09
13
10
11
12
09
13
10
11
12
09
13
64%
1959
27%
16 12
17%
66%
2256
32%
16 12
16%
68%
2753
35%
19 14
15%
59%
2059
23%
15 12
18%
70%
2654
33%
19 13
15%
Consumer
Business
P20
P12
25
Business overview Business review Governance Financial statements