Experian 2013 Annual Report Download - page 120
Download and view the complete annual report
Please find page 120 of the 2013 Experian annual report below. You can navigate through the pages in the report by either clicking on the pages listed below, or by using the keyword search tool below to find specific information within the annual report.-
 1
1 -
2
-
3
-
4
-
5
-
6
-
7
-
8
-
9
-
10
-
11
-
12
-
13
-
14
-
15
-
16
-
17
-
18
-
19
-
20
-
21
-
22
-
23
-
24
-
25
-
26
-
27
-
28
-
29
-
30
-
31
-
32
-
33
-
34
-
35
-
36
-
37
-
38
-
39
-
40
-
41
-
42
-
43
-
44
-
45
-
46
-
47
-
48
-
49
-
50
-
51
-
52
-
53
-
54
-
55
-
56
-
57
-
58
-
59
-
60
-
61
-
62
-
63
-
64
-
65
-
66
-
67
-
68
-
69
-
70
-
71
-
72
-
73
-
74
-
75
-
76
-
77
-
78
-
79
-
80
-
81
-
82
-
83
-
84
-
85
-
86
-
87
-
88
-
89
-
90
-
91
-
92
-
93
-
94
-
95
-
96
-
97
-
98
-
99
-
100
-
101
-
102
-
103
-
104
-
105
-
106
-
107
-
108
-
109
-
 110
110 -
 111
111 -
 112
112 -
 113
113 -
 114
114 -
 115
115 -
 116
116 -
 117
117 -
 118
118 -
 119
119 -
 120
120 -
 121
121 -
 122
122 -
 123
123 -
 124
124 -
 125
125 -
 126
126 -
 127
127 -
 128
128 -
 129
129 -
 130
130 -
131
-
132
-
133
-
134
-
135
-
136
-
137
-
138
-
139
-
140
-
141
-
142
-
143
-
144
-
145
-
146
-
147
-
148
-
149
-
150
-
151
-
152
-
153
-
154
-
155
-
156
-
157
-
158
-
159
-
160
-
161
-
162
-
163
-
164
-
165
-
166
-
167
-
168
-
169
-
170
-
171
-
172
-
173
-
174
-
175
-
176
 |
 |

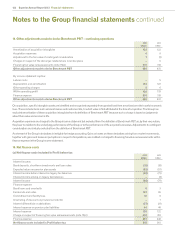
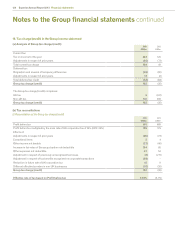
118 Experian Annual Report 2013 Financial statements
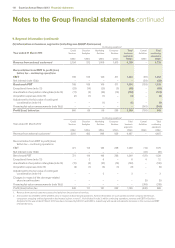
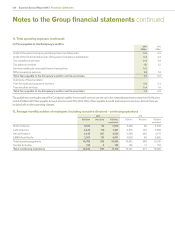
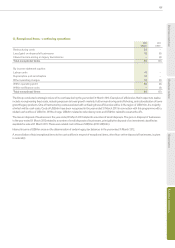
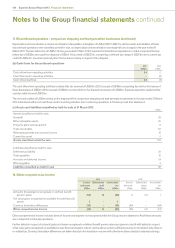
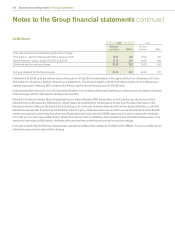
Notes to the Group financial statements continued
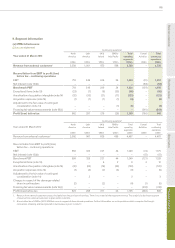
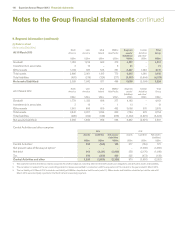
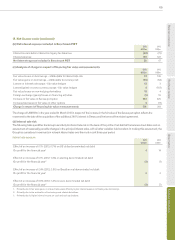
9. Segment information (continued)
(b) Information on business segments (including non-GAAP disclosures)
Continuing operations2
Year ended 31 March 2013
Credit
Services
US$m
Decision
Analytics
US$m
Marketing
Services
US$m
Consumer
Services
US$m
Total
business
segments
US$m
Central
Activities
US$m
Total
continuing
operations
US$m
Revenue from external customers12,194 512 1,009 1,015 4,730 – 4,730
Reconciliation from EBIT to profit/(loss)
before tax – continuing operations
EBIT 768 109 146 311
1,334 (81) 1,253
Net interest (note 15(b)) – – – – – (58) (58)
Benchmark PBT 768 109 146 311
1,334 (139) 1,195
Exceptional items (note 13) (29) (14) (20) (3) (66) – (66)
Amortisation of acquisition intangibles (note 14) (71) (5) (28) (19) (123) – (123)
Acquisition expenses (note 14) (2) (1) (1) – (4) – (4)
Adjustment to the fair value of contingent
consideration (note 14) – – (1) – (1) – (1)
Financing fair value remeasurements (note 15(c)) – – – – – (561) (561)
Profit/(loss) before tax 666 89 96 289 1,140 (700) 440
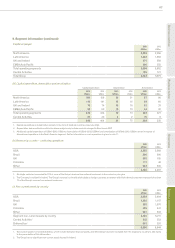
Continuing operations2
Year ended 31 March 2012
Credit
Services
US$m
Decision
Analytics
US$m
Marketing
Services
US$m
Consumer
Services
US$m
Total
business
segments
US$m
Central
Activities
US$m
Total
continuing
operations
US$m
Revenue from external customers12,116 493 949 929 4,487 – 4,487
Reconciliation from EBIT to profit/(loss)
before tax – continuing operations
EBIT 721 114 146 268 1,249 (74) 1,175
Net interest (note 15(b)) – – – – – (47) (47)
Benchmark PBT 721 114 146 268 1,249 (121) 1,128
Exceptional items (note 13) – 2 6 – 8 4 12
Amortisation of acquisition intangibles (note 14) (72) (4) (31) (15) (122) – (122)
Acquisition expenses (note 14) (4) (1) (3) (1) (9) – (9)
Adjustment to the fair value of contingent
consideration (note 14) – – 3 – 3 – 3
Charges in respect of the demerger-related
share incentive plans – – – – – (5) (5)
Financing fair value remeasurements (note 15(c)) – – – – – (318) (318)
Profit/(loss) before tax 645 111 121 252 1,129 (440) 689
1. Revenue from external customers arose principally from the provision of services.
2. A loss before tax of US$5m (2012: US$9m) arose in respect of discontinued operations. Further information on such operations which comprise the Group’s
comparison shopping and lead generation businesses is given in note 17. As indicated in note 3, within continuing operations, revenue and EBIT in Decision
Analytics for the year ended 31 March 2012 have been increased by US$17m and US$7m respectively with equal and opposite decreases in the revenue and EBIT
of Credit Services.