Experian 2013 Annual Report Download - page 150
Download and view the complete annual report
Please find page 150 of the 2013 Experian annual report below. You can navigate through the pages in the report by either clicking on the pages listed below, or by using the keyword search tool below to find specific information within the annual report.-
 1
1 -
2
-
3
-
4
-
5
-
6
-
7
-
8
-
9
-
10
-
11
-
12
-
13
-
14
-
15
-
16
-
17
-
18
-
19
-
20
-
21
-
22
-
23
-
24
-
25
-
26
-
27
-
28
-
29
-
30
-
31
-
32
-
33
-
34
-
35
-
36
-
37
-
38
-
39
-
40
-
41
-
42
-
43
-
44
-
45
-
46
-
47
-
48
-
49
-
50
-
51
-
52
-
53
-
54
-
55
-
56
-
57
-
58
-
59
-
60
-
61
-
62
-
63
-
64
-
65
-
66
-
67
-
68
-
69
-
70
-
71
-
72
-
73
-
74
-
75
-
76
-
77
-
78
-
79
-
80
-
81
-
82
-
83
-
84
-
85
-
86
-
87
-
88
-
89
-
90
-
91
-
92
-
93
-
94
-
95
-
96
-
97
-
98
-
99
-
100
-
101
-
102
-
103
-
104
-
105
-
106
-
107
-
108
-
109
-
110
-
111
-
112
-
113
-
114
-
115
-
116
-
117
-
118
-
119
-
120
-
121
-
122
-
123
-
124
-
125
-
126
-
127
-
128
-
129
-
130
-
131
-
132
-
133
-
134
-
135
-
136
-
137
-
138
-
139
-
 140
140 -
 141
141 -
 142
142 -
 143
143 -
 144
144 -
 145
145 -
 146
146 -
 147
147 -
 148
148 -
 149
149 -
 150
150 -
 151
151 -
 152
152 -
 153
153 -
 154
154 -
 155
155 -
 156
156 -
 157
157 -
 158
158 -
 159
159 -
 160
160 -
161
-
162
-
163
-
164
-
165
-
166
-
167
-
168
-
169
-
170
-
171
-
172
-
173
-
174
-
175
-
176
 |
 |

148 Experian Annual Report 2013 Financial statements
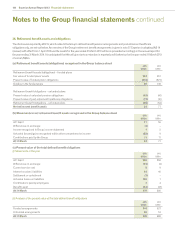
Notes to the Group financial statements continued
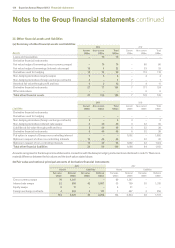
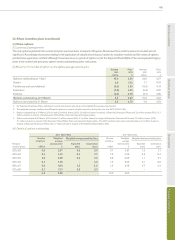
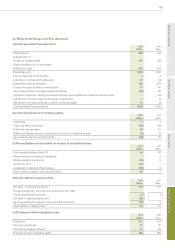
38. Deferred and current tax
(a) Deferred tax
(i) Net deferred tax assets/(liabilities)
2013
US$m
2012
US$m
At 1 April (59) (121)
Differences on exchange 29 14
Tax credit in the Group income statement – continuing operations (note 16) 32 84
Tax charge in the Group income statement – discontinued operations (note 17) (13) (2)
Business combinations (note 45) (3) (73)
Tax recognised within other comprehensive income (note 18) 14 (2)
Tax recognised directly in equity on transactions with owners (note 41) 456 5
Transfer in respect of liabilities held for sale (36) 38
Other transfers 1 (2)
At 31 March 421 (59)
Net deferred tax assets/(liabilities) are presented in the Group balance sheet as:
Deferred tax assets 643 320
Deferred tax liabilities (222) (379)
At 31 March 421 (59)
(ii) Gross deferred tax assets
Movements in gross deferred tax assets, without taking into consideration the offsetting of assets and liabilities within the same tax jurisdiction,
comprise:
Accelerated
depreciation
US$m
Intangibles
US$m
Share
incentive
plans
US$m
Tax losses
US$m
Other
temporary
differences
US$m
Total
US$m
At 1 April 2012 24 24 58 300 140 546
Differences on exchange – – – – 3 3
Tax (charge)/credit in the Group income statement –
continuing operations (2) 133 1 (74) 4 62
Tax credit in the Group income statement – discontinued
operations –––7710
87
Tax recognised within other comprehensive income ––––14
14
Tax recognised directly in equity on transactions with
owners – 462 (6) – – 456
Other transfers – – – – 1 1
At 31 March 2013 22 619 53 303 172 1,169
Accelerated
depreciation
US$m
Intangibles
US$m
Share
incentive
plans
US$m
Tax losses
US$m
Other
temporary
differences
US$m
Total
US$m
At 1 April 2011 8 26 56 117 161 368
Differences on exchange – – – – 22 22
Tax credit/(charge) in the Group income statement 16 (2) (3) 183 (64) 130
Business combinations – – – – 26 26
Tax recognised directly in equity on transactions with
owners – – 5 – – 5
Other transfers – – – – (5) (5)
At 31 March 2012 24 24 58 300 140 546
The Group has not recognised deferred tax assets of US$106m (2012: US$123m) in respect of losses that can be carried forward against future
taxable income and deferred tax assets of US$13m (2012: US$15m) in respect of capital losses that can be carried forward against future
taxable gains. These losses are available indefinitely. At the balance sheet date there were deferred tax assets expected to reverse within the
next year of US$186m (2012: US$90m).