Experian 2013 Annual Report Download - page 49
Download and view the complete annual report
Please find page 49 of the 2013 Experian annual report below. You can navigate through the pages in the report by either clicking on the pages listed below, or by using the keyword search tool below to find specific information within the annual report.-
 1
1 -
2
-
3
-
4
-
5
-
6
-
7
-
8
-
9
-
10
-
11
-
12
-
13
-
14
-
15
-
16
-
17
-
18
-
19
-
20
-
21
-
22
-
23
-
24
-
25
-
26
-
27
-
28
-
29
-
30
-
31
-
32
-
33
-
34
-
35
-
36
-
37
-
38
-
 39
39 -
 40
40 -
 41
41 -
 42
42 -
 43
43 -
 44
44 -
 45
45 -
 46
46 -
 47
47 -
 48
48 -
 49
49 -
 50
50 -
 51
51 -
 52
52 -
 53
53 -
 54
54 -
 55
55 -
 56
56 -
 57
57 -
 58
58 -
 59
59 -
60
-
61
-
62
-
63
-
64
-
65
-
66
-
67
-
68
-
69
-
70
-
71
-
72
-
73
-
74
-
75
-
76
-
77
-
78
-
79
-
80
-
81
-
82
-
83
-
84
-
85
-
86
-
87
-
88
-
89
-
90
-
91
-
92
-
93
-
94
-
95
-
96
-
97
-
98
-
99
-
100
-
101
-
102
-
103
-
104
-
105
-
106
-
107
-
108
-
109
-
110
-
111
-
112
-
113
-
114
-
115
-
116
-
117
-
118
-
119
-
120
-
121
-
122
-
123
-
124
-
125
-
126
-
127
-
128
-
129
-
130
-
131
-
132
-
133
-
134
-
135
-
136
-
137
-
138
-
139
-
140
-
141
-
142
-
143
-
144
-
145
-
146
-
147
-
148
-
149
-
150
-
151
-
152
-
153
-
154
-
155
-
156
-
157
-
158
-
159
-
160
-
161
-
162
-
163
-
164
-
165
-
166
-
167
-
168
-
169
-
170
-
171
-
172
-
173
-
174
-
175
-
176
 |
 |

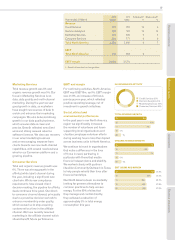
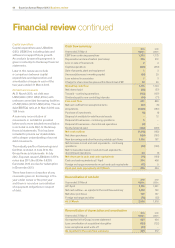
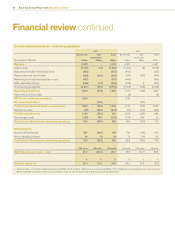
Group balance sheet commentary
Net assets
An analysis of net assets and capital
employed is given in the net assets
summary table. As part of our internal
reporting process, capital employed
is monitored by operating segment
and further information by operating
segment is given in note 9(a) to the
Group financial statements.
Capital employed includes net pension
assets of US$24m (2012: US$77m)
and net derivative financial assets of
US$59m (2012: US$92m) where the
balance sheet values are a function of
external market conditions.
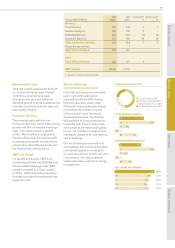
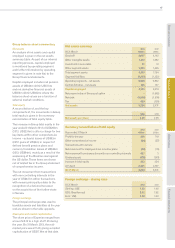
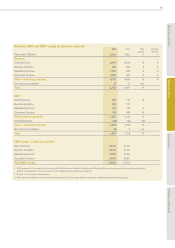
Total equity
A reconciliation of, and the key
components of, the movements in Group
total equity is given in the summary
reconciliation of total equity table.
The increase in Group total equity in the
year ended 31 March 2013 of US$293m
(2012: US$224m) is after a charge for two
key items within other comprehensive
income – actuarial losses of US$62m
(2012: gains of US$9m) in respect of
defined benefit pension plans and
currency translation losses of US$39m
(2012: US$64m), mainly as a result of the
weakening of the Brazilian real against
the US dollar. These items are shown
net of related tax in the Group statement
of comprehensive income.
The net movement from transactions
with non-controlling interests in the
year of US$427m within transactions
with owners principally relates to the
recognition of a deferred tax asset
on the acquisition of the further stake
in Serasa.
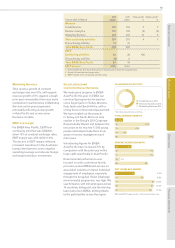
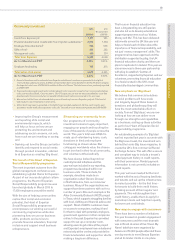
Foreign exchange
The principal exchange rates used to
translate assets and liabilities at the year
end are shown in the table opposite.
Share price and market capitalisation
The share price of Experian ranged from
a low of £8.70 to a high of £11.85 during
the year. On 31 March 2013, the mid-
market price was £11.40, giving a market
capitalisation of US$17.8bn at that date.
Net assets summary
At 31 March
2013
US$m
2012
US$m
Goodwill 4,057 4,163
Other intangible assets 1,474 1,582
Investment in associates 21 13
Other segment assets 1,363 1,426
Total segment assets 6,915 7,184
Segment liabilities (1,307) (1,332)
Operating segments – net assets 5,608 5,852
Central Activities – net assets 125 127
Capital employed 5,733 5,979
Net present value of Serasa put option –(1,092)
Net debt (2,938) (1,818)
Tax 429 (138)
Net assets 3,224 2,931
US$ US$
Net assets per share 3.26 2.96
Summary reconciliation of total equity
Year ended 31 March
2013
US$m
2012
US$m
Profit for the year 406 718
Other comprehensive income (84) (57)
Transactions with owners:
Net movement for employee share incentive plans (80) (79)
Net movement from transactions with non-controlling interests 427 3
Dividends paid (376) (361)
Increase in total equity 293 224
At 1 April 2,931 2,707
At 31 March 3,224 2,931
Foreign exchange – closing rates
At 31 March 2013 2012
Sterling : US$ 1.52 1.60
US$ : Brazilian real 2.02 1.82
Euro : US$ 1.28 1.33
Business overview Business review Governance Financial statements
47