Dish Network 2012 Annual Report Download - page 93
Download and view the complete annual report
Please find page 93 of the 2012 Dish Network annual report below. You can navigate through the pages in the report by either clicking on the pages listed below, or by using the keyword search tool below to find specific information within the annual report.-
 1
1 -
2
-
3
-
4
-
5
-
6
-
7
-
8
-
9
-
10
-
11
-
12
-
13
-
14
-
15
-
16
-
17
-
18
-
19
-
20
-
21
-
22
-
23
-
24
-
25
-
26
-
27
-
28
-
29
-
30
-
31
-
32
-
33
-
34
-
35
-
36
-
37
-
38
-
39
-
40
-
41
-
42
-
43
-
44
-
45
-
46
-
47
-
48
-
49
-
50
-
51
-
52
-
53
-
54
-
55
-
56
-
57
-
58
-
59
-
60
-
61
-
62
-
63
-
64
-
65
-
66
-
67
-
68
-
69
-
70
-
71
-
72
-
73
-
74
-
75
-
76
-
77
-
78
-
79
-
80
-
81
-
82
-
 83
83 -
 84
84 -
 85
85 -
 86
86 -
 87
87 -
 88
88 -
 89
89 -
 90
90 -
 91
91 -
 92
92 -
 93
93 -
 94
94 -
 95
95
 |
 |

DISH NETWORK CORPORATION
NOTES TO CONSOLIDATED FINANCIAL STATEMENTS - Continued
F-76
Other Agreements
In November 2009, Mr. Roger Lynch became employed by both us and EchoStar as Executive Vice President. Mr.
Lynch is responsible for the development and implementation of advanced technologies that are of potential utility
and importance to both DISH Network and EchoStar. Mr. Lynch’s compensation consists of cash and equity
compensation and is borne by both EchoStar and DISH Network.
Related Party Transactions with NagraStar L.L.C.
NagraStar is a joint venture between EchoStar and Nagra USA, Inc. that is our provider of encryption and related
security systems intended to assure that only authorized customers have access to our programming.
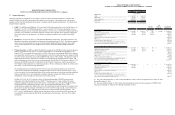
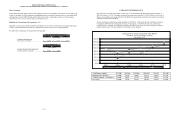
The table below summarizes our transactions with NagraStar.
2012 2011 2010
Pu rchases (including fees):
Purchases from NagraStar................................ $ 72,549 $ 77,705 $ 79,547
2012 2011
Amounts Payable and Commitments:
Amounts payable to NagraStar......................... $ 21,930 $ 5,853
(In thou sand s)
As of December 31,
(In thousands)
For the Years Ended Dece mber 31,
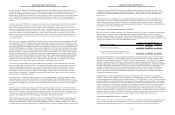
COMPARATIVE PERFORMANCE
The graph below sets forth the cumulative total return to our shareholders during the period from December 31,
2007 to December 31, 2012. The graph assumes the investment on December 31, 2007 of $100 in (i) our Class A
Shares, (ii) an industry peer group and (iii) the NASDAQ Composite Index and reflects reinvestment of dividends
and market capitalization weighting.
We have included an industry peer group comprised of: AT&T Inc., Cablevision Systems Corporation, Comcast
Corporation, DISH Network Corporation, The DirecTV Group, Inc., Time Warner Cable, Inc., and Verizon
Communications. Although the companies included in the industry peer group were selected because of similar
industry characteristics, they are not entirely representative of our business.
Total Return Analysis 12/31/2007 12/31/2008 12/31/2009 12/31/2010 12/31/2011 12/31/2012
DISH Network Corporation $ 100.00 $ 33.32 $ 68.43 $ 64.77 $ 101.47 $ 133.25
NASDAQ Composite – Total Returns $ 100.00 $ 60.02 $ 87.25 $ 103.08 $ 102.27 $ 120.41
Peer Group $ 100.00 $ 75.75 $ 85.12 $ 101.94 $ 113.78 $ 142.49
Comparison of 5 Year Cumulative Total Return
Assumes Initial Investment of $100
December 2012
0.00
20.00
40.00
60.00
80.00
100.00
120.00
140.00
160.00
2007 2008 2009 2010 2011 2012
DISH Network Corp NASDAQ Composite-Total Returns Peer Group