Dish Network 2012 Annual Report Download - page 42
Download and view the complete annual report
Please find page 42 of the 2012 Dish Network annual report below. You can navigate through the pages in the report by either clicking on the pages listed below, or by using the keyword search tool below to find specific information within the annual report.-
 1
1 -
2
-
3
-
4
-
5
-
6
-
7
-
8
-
9
-
10
-
11
-
12
-
13
-
14
-
15
-
16
-
17
-
18
-
19
-
20
-
21
-
22
-
23
-
24
-
25
-
26
-
27
-
28
-
29
-
30
-
31
-
 32
32 -
 33
33 -
 34
34 -
 35
35 -
 36
36 -
 37
37 -
 38
38 -
 39
39 -
 40
40 -
 41
41 -
 42
42 -
 43
43 -
 44
44 -
 45
45 -
 46
46 -
 47
47 -
 48
48 -
 49
49 -
 50
50 -
 51
51 -
 52
52 -
53
-
54
-
55
-
56
-
57
-
58
-
59
-
60
-
61
-
62
-
63
-
64
-
65
-
66
-
67
-
68
-
69
-
70
-
71
-
72
-
73
-
74
-
75
-
76
-
77
-
78
-
79
-
80
-
81
-
82
-
83
-
84
-
85
-
86
-
87
-
88
-
89
-
90
-
91
-
92
-
93
-
94
-
95
 |
 |

Item 7. MANAGEMENT’S DISCUSSION AND ANALYSIS OF FINANCIAL CONDITION AND
RESULTS OF OPERATIONS - Continued
72
72
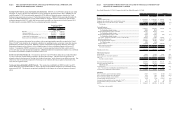
Pay-TV subscribers. DISH lost approximately 166,000 net Pay-TV subscribers during the year ended December
31, 2011, compared to a gain of approximately 33,000 net new Pay-TV subscribers during the same period in 2010.
The change versus the prior year primarily resulted from a decline in gross new Pay-TV subscriber activations.
During the year ended December 31, 2011, DISH added approximately 2.576 million gross new Pay-TV subscribers
compared to approximately 3.052 million gross new Pay-TV subscribers during the same period in 2010, a decrease
of 15.6%.
Our gross activations and net Pay-TV subscriber additions were negatively impacted during the year ended
December 31, 2011 compared to the same period in 2010 as a result of increased competitive pressures, including
aggressive marketing and the effectiveness of certain competitors’ promotional offers, which included an increased
level of programming discounts. In addition, telecommunications companies continue to grow their respective
customer bases. Our gross activations and net Pay-TV subscriber additions continue to be adversely affected during
the year ended December 31, 2011 by sustained economic weakness and uncertainty, including, among other things,
the weak housing market in the United States combined with lower discretionary spending.
Our Pay-TV churn rate for the year ended December 31, 2011 was 1.63%, compared to 1.76% for the same period
in 2010. While our Pay-TV churn rate improved compared to the same period in 2010, our Pay-TV churn rate
continues to be adversely affected by the increased competitive pressures discussed above. In general, our Pay-TV
churn rate is impacted by the quality of Pay-TV subscribers acquired in past quarters, our ability to provide
outstanding customer service, and our ability to control piracy.
Subscriber-related revenue. DISH “Subscriber-related revenue” totaled $12.976 billion for the year ended December
31, 2011, an increase of $432 million or 3.4% compared to the same period in 2010. This change was primarily
related to the increase in “ARPU” discussed below.
ARPU. “Average monthly revenue per subscriber” was $76.93 during the year ended December 31, 2011 versus
$73.32 during the same period in 2010. The $3.61 or 4.9% increase in ARPU was primarily attributable to price
increases during the past year, higher hardware related revenue and fees earned from our in-home service operations,
partially offset by decreases in premium and pay per view revenue.
Equipment and merchandise sales, rental and other revenue. “Equipment and merchandise sales, rental and other
revenue” totaled $1.036 billion for the year ended December 31, 2011, an increase of $976 million compared to the
same period in 2010. This increase was primarily driven by revenue from the rental of movies and video games, the
sale of previously rented titles, and other merchandise sold to customers including movies, video games and other
accessories related to our Blockbuster operations which commenced April 26, 2011.
Subscriber-related expenses. “Subscriber-related expenses” totaled $6.846 billion during the year ended December
31, 2011, an increase of $169 million or 2.5% compared to the same period in 2010. The increase in “Subscriber-
related expenses” was primarily attributable to higher programming costs and an increase in customer retention
expense, partially offset by reduced costs related to our call centers. The increase in programming costs was driven by
rate increases in certain of our programming contracts, including the renewal of certain contracts at higher rates.
“Subscriber-related expenses” represented 52.8% and 53.2% of “Subscriber-related revenue” during the year ended
December 31, 2011 and 2010, respectively. The improvement in this expense to revenue ratio primarily resulted from
an increase in “Subscriber-related revenue,” partially offset by higher programming costs, discussed above.
Cost of sales – equipment, merchandise, services, rental and other. “Cost of sales – equipment, merchandise,
services, rental and other” totaled $449 million for the year ended December 31, 2011, an increase of $372 million
compared to the same period in 2010. This increase is primarily associated with the cost of rental title purchases or
revenue sharing to studios, packaging and on-line delivery costs as well as the cost of merchandise sold such as
movies, video games and other accessories related to our Blockbuster operations which commenced April 26, 2011.
Subscriber acquisition costs. “Subscriber acquisition costs” totaled $1.505 billion for the year ended December 31,
2011, a decrease of $148 million or 9.0% compared to the same period in 2010. This decrease was primarily
attributable to a decline in gross new subscriber activations.
Item 7. MANAGEMENT’S DISCUSSION AND ANALYSIS OF FINANCIAL CONDITION AND
RESULTS OF OPERATIONS - Continued
73
73
SAC. SAC was $771 during the year ended December 31, 2011 compared to $776 during the same period in 2010, a
decrease of $5 or 0.6%. This decrease was primarily attributable to an increase in the percentage of redeployed
receivers that were installed.
During the years ended December 31, 2011 and 2010, the amount of equipment capitalized under our lease program
for new subscribers totaled $480 million and $716 million, respectively. This decrease in capital expenditures under
our lease program for new subscribers resulted primarily from a decrease in gross new subscriber activations and an
increase in the percentage of redeployed receivers that were installed.
Capital expenditures resulting from our equipment lease program for new subscribers were partially mitigated by the
redeployment of equipment returned by disconnecting lease program subscribers. To remain competitive we
upgrade or replace subscriber equipment periodically as technology changes, and the costs associated with these
upgrades may be substantial. To the extent technological changes render a portion of our existing equipment
obsolete, we would be unable to redeploy all returned equipment and consequently would realize less benefit from
the SAC reduction associated with redeployment of that returned lease equipment.
Our SAC calculation does not reflect any benefit from payments we received in connection with equipment not
returned to us from disconnecting lease subscribers and returned equipment that is made available for sale or used in
our existing customer lease program rather than being redeployed through our new customer lease program. During
the years ended December 31, 2011 and 2010, these amounts totaled $96 million and $108 million, respectively.
General and administrative expenses. “General and administrative expenses” totaled $1.234 billion during the year
ended December 31, 2011, a $609 million increase compared to the same period in 2010. This increase was primarily
due to an increase in personnel, building and maintenance and other administrative costs associated with our
Blockbuster operations which commenced April 26, 2011.
Litigation expense. “Litigation expense” totaled a negative $317 million during the year ended December 31, 2011,
a reduction in expense of $542 million compared to the same period in 2010. See Note 20 in the Notes to our
Consolidated Financial Statements in Item 15 of this Annual Report on Form 10-K for further discussion.
Depreciation and amortization. “Depreciation and amortization” expense totaled $922 million during the year ended
December 31, 2011, a $62 million or 6.3% decrease compared to the same period in 2010. This change in
“Depreciation and amortization” expense was primarily due to a decrease in depreciation on equipment leased to
subscribers principally related to less equipment capitalization during 2011 compared to the same period in 2010 and
less equipment write-offs from disconnecting subscribers. This decrease was partially offset by an increase in
depreciation on satellites as a result of EchoStar XIV and EchoStar XV being placed into service during the second and
third quarters 2010, respectively.
Interest expense, net of amounts capitalized. “Interest expense, net of amounts capitalized” totaled $558 million
during the year ended December 31, 2011, an increase of $103 million or 22.7% compared to the same period in 2010.
This change primarily resulted from an increase in interest expense related to the issuance of our 6 3/4% Senior
Notes due 2021 during the second quarter 2011 and a decrease in the amount of interest capitalized, partially offset
by a decrease in interest expense as a result of the repurchases and redemptions of our 6 3/8% Senior Notes due
2011.