Dish Network 2012 Annual Report Download - page 64
Download and view the complete annual report
Please find page 64 of the 2012 Dish Network annual report below. You can navigate through the pages in the report by either clicking on the pages listed below, or by using the keyword search tool below to find specific information within the annual report.-
 1
1 -
2
-
3
-
4
-
5
-
6
-
7
-
8
-
9
-
10
-
11
-
12
-
13
-
14
-
15
-
16
-
17
-
18
-
19
-
20
-
21
-
22
-
23
-
24
-
25
-
26
-
27
-
28
-
29
-
30
-
31
-
32
-
33
-
34
-
35
-
36
-
37
-
38
-
39
-
40
-
41
-
42
-
43
-
44
-
45
-
46
-
47
-
48
-
49
-
50
-
51
-
52
-
53
-
 54
54 -
 55
55 -
 56
56 -
 57
57 -
 58
58 -
 59
59 -
 60
60 -
 61
61 -
 62
62 -
 63
63 -
 64
64 -
 65
65 -
 66
66 -
 67
67 -
 68
68 -
 69
69 -
 70
70 -
 71
71 -
 72
72 -
 73
73 -
 74
74 -
75
-
76
-
77
-
78
-
79
-
80
-
81
-
82
-
83
-
84
-
85
-
86
-
87
-
88
-
89
-
90
-
91
-
92
-
93
-
94
-
95
 |
 |

DISH NETWORK CORPORATION
NOTES TO CONSOLIDATED FINANCIAL STATEMENTS - Continued
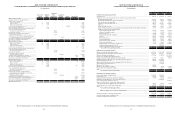
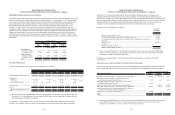
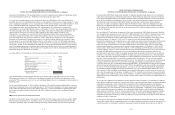
The “Accumulated other comprehensive income (loss)” is detailed in the following table.
Foreign Unrealized /
Currency Recognized
Translation Gains
Accumulated Other Comprehensive Income (Loss) Adjustment (Losses) Total
(In thousands)
Balance as of December 31, 2010.......................................................... -$ 93,357$ 93,357$
Current period activity............................................................................. (9,139) (2,175) (11,314)
Tax (expense) benefit............................................................................... - - -
Balance as of December 31, 2011.......................................................... (9,139)$ 91,182$ 82,043$
Current period activity............................................................................. 4,106 115,546 119,652
Tax (expense) benefit............................................................................... - (12,892) (12,892)
Balance as of December 31, 2012.......................................................... (5,033)$ 193,836$ 188,803$
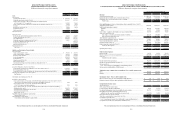
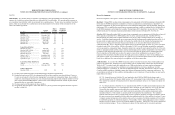
6. Marketable Investment Securities, Restricted Cash and Cash Equivalents, and Other Investment
Securities
Our marketable investment securities, restricted cash and cash equivalent, and other investment securities consist of the
following:
As of December 31,
2012 2011
(In thousands)
Marketable investment securities:
Current marketable investment securities - VRDNs............................................. 130,306$ 160,555$
Current marketable investment securities - strategic............................................. 1,261,015 360,052
Current marketable investment securities - other.................................................. 2,240,316 911,138
Total current marketable investment securities.............................................. 3,631,637 1,431,745
Restricted marketable investment securities (1).................................................... 51,366 65,843
Noncurrent marketable investment securities - ARS and other (2)....................... 106,172 109,327
Total marketable investment securities....................................................... 3,789,175 1,606,915
Restricted cash and cash equivalents (1).......................................................... 83,044 66,592
Other investment securities:
Other investment securities - cost method (2)....................................................... 12,879 2,805
Investment in DBSD North America.................................................................... - 1,297,614
Total other investment securities.................................................................. 12,879 1,300,419
Total marketable investment securities, restricted cash
and cash equivalents, and other investment securities................................. 3,885,098$ 2,973,926$
(1) Restricted marketable investment securities and restricted cash and cash equivalents are included in “Restricted
cash and marketable investment securities” on our Consolidated Balance Sheets.
(2) Noncurrent marketable investment securities – auction rate securities (“ARS”) and other investment securities are
included in “Marketable and other investment securities” on our Consolidated Balance Sheets.
F-18
DISH NETWORK CORPORATION
NOTES TO CONSOLIDATED FINANCIAL STATEMENTS - Continued
Marketable Investment Securities
Our marketable investment securities portfolio consists of various debt and equity instruments, all of which are
classified as available-for-sale, except as specified below (see Note 2).
Current Marketable Investment Securities – VRDNs
Variable rate demand notes (“VRDNs”) are long-term floating rate municipal bonds with embedded put options that
allow the bondholder to sell the security at par plus accrued interest. All of the put options are secured by a pledged
liquidity source. Our VRDN portfolio is comprised mainly of investments in municipalities, which are backed by
financial institutions or other highly rated obligors that serve as the pledged liquidity source. While they are
classified as marketable investment securities, the put option allows VRDNs to be liquidated generally on a same
day or on a five business day settlement basis.
Current Marketable Investment Securities – Strategic
Our current strategic marketable investment securities include strategic and financial investments in public
companies that are highly speculative and have experienced and continue to experience volatility. As of December
31, 2012, our strategic investment portfolio consisted of securities of a small number of issuers, and as a result the
value of that portfolio depends on the value of those issuers. In addition, a significant portion of the value of these
investments is concentrated in the debt securities of a single issuer. The adjusted cost basis of the securities of that
single issuer as of December 31, 2012 and 2011 was $751 million and $16 million, respectively. The fair value of
the securities of that single issuer as of December 31, 2012 and 2011 was $951 million and $17 million,
respectively. These debt securities have a call option, held by the issuer, upon 30 days notice after December 1,
2012. The call option price is less than the fair market value of these debt securities and, if exercised, proceeds
would be less than our recorded fair market value and therefore, reduce our unrealized gains recorded as a separate
component of “Accumulated other comprehensive income (loss)” within “Total stockholders’ equity (deficit),” on
our Consolidated Balance Sheets. This potential reduction in our unrealized gain related to the call option on these
debt securities would have no impact on our results of operations. In addition, this single issuer has indicated that it
will need substantial additional capital to meet its business and financial obligations beyond the next 12 months.
The fair value of certain of the debt securities in our investment portfolio, including those of that single issuer, can
be adversely impacted by, among other things, the issuers’ respective performance and ability to obtain any
necessary additional financing on acceptable terms, or at all.
Current Marketable Investment Securities – Other
Our current marketable investment securities portfolio includes investments in various debt instruments including
corporate and government bonds.
Restricted Cash and Marketable Investment Securities
As of December 31, 2012 and 2011, our restricted marketable investment securities, together with our restricted
cash, included amounts required as collateral for our letters of credit or surety bonds and for litigation (See Note
16).
Noncurrent Marketable Investment Securities – ARS and Other Investment Securities
We have investments in ARS and other investment securities which are either classified as available-for-sale
securities or are accounted for under the fair value method. Previous events in the credit markets reduced or
eliminated current liquidity for certain of our ARS and other investment securities. As a result, we classify these
investments as noncurrent assets, as we intend to hold these investments until they recover or mature. See below for
further discussion on the July 1, 2010 fair value election on certain ARS investments.
F-19