Dish Network 2012 Annual Report Download - page 44
Download and view the complete annual report
Please find page 44 of the 2012 Dish Network annual report below. You can navigate through the pages in the report by either clicking on the pages listed below, or by using the keyword search tool below to find specific information within the annual report.-
 1
1 -
2
-
3
-
4
-
5
-
6
-
7
-
8
-
9
-
10
-
11
-
12
-
13
-
14
-
15
-
16
-
17
-
18
-
19
-
20
-
21
-
22
-
23
-
24
-
25
-
26
-
27
-
28
-
29
-
30
-
31
-
32
-
33
-
 34
34 -
 35
35 -
 36
36 -
 37
37 -
 38
38 -
 39
39 -
 40
40 -
 41
41 -
 42
42 -
 43
43 -
 44
44 -
 45
45 -
 46
46 -
 47
47 -
 48
48 -
 49
49 -
 50
50 -
 51
51 -
 52
52 -
 53
53 -
 54
54 -
55
-
56
-
57
-
58
-
59
-
60
-
61
-
62
-
63
-
64
-
65
-
66
-
67
-
68
-
69
-
70
-
71
-
72
-
73
-
74
-
75
-
76
-
77
-
78
-
79
-
80
-
81
-
82
-
83
-
84
-
85
-
86
-
87
-
88
-
89
-
90
-
91
-
92
-
93
-
94
-
95
 |
 |

Item 7. MANAGEMENT’S DISCUSSION AND ANALYSIS OF FINANCIAL CONDITION AND
RESULTS OF OPERATIONS - Continued
76
76
for the TiVo and Retailer Class Action settlements. The decrease in “Purchases of property and equipment” in 2011
was primarily attributable to a decrease in satellite construction and a decline in expenditures for equipment under our
lease programs for new and existing subscribers of $241 million.
On December 17, 2010, the Tax Relief, Unemployment Insurance Reauthorization and Job Creation Act of 2010 was
enacted, which provides for a bonus depreciation deduction of 100% of the cost of our qualified capital expenditures
from September 8, 2010 through December 31, 2011. During the year ended December 31, 2011, our “Deferred
income tax expense (benefit)” recorded as a non-cash adjustment to net income on our Consolidated Statements of
Cash Flows increased $427 million compared to the same period in 2010. This change is primarily associated with
equipment-related temporary differences as a result of bonus depreciation deductions available in 2011.
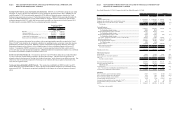
Cash flows from operating activities. We typically reinvest the cash flow from operating activities in our business
primarily to grow our subscriber base and to expand our infrastructure. For the years ended December 31, 2012,
2011 and 2010, we reported net cash flows from operating activities of $2.012 billion, $2.574 billion, and $2.140
billion, respectively. See discussion of changes in net cash flows from operating activities included in “Free cash
flow” above.
Cash flows from investing activities. Our investing activities generally include purchases and sales of marketable
investment securities, acquisitions, strategic investments and cash used to grow our subscriber base and expand our
infrastructure. For the years ended December 31, 2012, 2011 and 2010, we reported net cash outflows from investing
activities of $3.019 billion, $2.695 billion and $1.478 billion, respectively. During the years ended December 31, 2012,
2011 and 2010, capital expenditures for new and existing pay-TV customer equipment totaled $703 million, $701
million and $942 million, respectively. During the year ended December 31, 2012, capital expenditures for new and
existing broadband customer equipment totaled $24 million, of which $22 million was for new broadband customer
equipment. During the years ended December 31, 2011 and 2010, capital expenditures for broadband customer
equipment were immaterial.
The increase in net cash outflows from investing activities from 2011 to 2012 of $324 million primarily related to net
purchases of marketable investment securities of $2.728 billion and capital expenditures of $179 million, partially
offset by a decrease in net purchases of strategic investments of $2.637 billion. The increase in capital expenditures
included $37 million for satellites, $26 million associated with our pay-TV and broadband subscriber acquisition and
retention lease programs and $116 million of other corporate capital expenditures. The decrease in net purchases of
strategic investments primarily resulted from our 2011 investments in DBSD North America of $1.139 billion and in
TerreStar of $1.345 billion.
The increase in net cash outflows from investing activities from 2010 to 2011 of $1.218 billion primarily resulted from
our investment in DBSD North America of $1.139 billion, the TerreStar Transaction of $1.345 billion, the Blockbuster
Acquisition of $127 million, net of $107 million cash received, and the Sprint Settlement Agreement net payment of
$114 million which were partially offset by a net increase in sales of marketable investment securities of $1.072 billion
and a decline in capital expenditures of $437 million.
Cash flows from financing activities. Our financing activities generally include net proceeds related to the issuance of
long-term debt, cash used for the repurchase, redemption or payment of long-term debt and capital lease obligations,
dividends paid on our Class A and Class B common stock and repurchases of our Class A common stock. For the
years ended December 31, 2012 and 2011, we reported net cash inflows from financing activities of $4.002 billion and
$94 million, respectively. For the year ended December 31, 2010, we reported net cash outflows from financing
activities of $127 million.
The net cash inflows in 2012 primarily related to the net proceeds of $4.387 billion related to the issuance of our 5
7/8% Senior Notes due 2022, our 4 5/8% Senior Notes due 2017 and our 5% Senior Notes due 2023, partially offset by
the $453 million dividend paid in cash on our Class A and Class B common stock.
The net cash inflows in 2011 primarily related to the proceeds of $1.973 billion from the issuance of our 6 3/4% Senior
Notes due 2021, net of deferred financing costs, partially offset by the redemption and repurchases of our 6 3/8%
Senior Notes due 2011 of $1.0 billion and our dividend payment of $893 million.
Item 7. MANAGEMENT’S DISCUSSION AND ANALYSIS OF FINANCIAL CONDITION AND
RESULTS OF OPERATIONS - Continued
77
77
The net cash outflows in 2010 primarily related to the repurchases of our Class A common stock.
Other Liquidity Items
Subscriber Base
DISH added approximately 89,000 net Pay-TV subscribers during the year ended December 31, 2012, compared to
a loss of approximately 166,000 net Pay-TV subscribers during the same period in 2011. The increase versus the
same period in 2011 primarily resulted from a decrease in our average monthly Pay-TV subscriber churn rate and
higher gross new Pay-TV subscriber activations due primarily to increased advertising associated with our Hopper
set-top box. See “Results of Operations” above for further discussion. There are a number of factors that impact
our future cash flow compared to the cash flow we generate at any given point in time, including our Pay-TV churn
rate and how successful we are at retaining our current Pay-TV subscribers. As we lose Pay-TV subscribers from
our existing base, the positive cash flow from that base is correspondingly reduced.
Satellites
Operation of our pay-TV service requires that we have adequate satellite transmission capacity for the programming
we offer. Moreover, current competitive conditions require that we continue to expand our offering of new
programming. While we generally have had in-orbit satellite capacity sufficient to transmit our existing channels
and some backup capacity to recover the transmission of certain critical programming, our backup capacity is
limited. In the event of a failure or loss of any of our satellites, we may need to acquire or lease additional satellite
capacity or relocate one of our other satellites and use it as a replacement for the failed or lost satellite. Such a
failure could result in a prolonged loss of critical programming or a significant delay in our plans to expand
programming as necessary to remain competitive and cause us to expend a significant portion of our cash to acquire
or lease additional satellite capacity.
Security Systems
Increases in theft of our signal or our competitors’ signals could, in addition to reducing new subscriber activations,
also cause subscriber churn to increase. We use Security Access Devices in our receiver systems to control access
to authorized programming content. Our signal encryption has been compromised in the past and may be
compromised in the future even though we continue to respond with significant investment in security measures,
such as Security Access Device replacement programs and updates in security software, that are intended to make
signal theft more difficult. It has been our prior experience that security measures may only be effective for short
periods of time or not at all and that we remain susceptible to additional signal theft. During 2009, we completed
the replacement of our Security Access Devices and re-secured our system. We expect additional future
replacements of these devices will be necessary to keep our system secure. We cannot ensure that we will be
successful in reducing or controlling theft of our programming content and we may incur additional costs in the
future if our system’s security is compromised.
Stock Repurchases
Our Board of Directors previously authorized the repurchase of up to $1.0 billion of our Class A common stock. On
November 2, 2012, our Board of Directors extended this authorization such that we are currently authorized to
repurchase up to $1.0 billion of outstanding shares of our Class A common stock through and including December
31, 2013. As of December 31, 2012, we may repurchase up to $1.0 billion under this plan. During the years ended
December 31, 2012 and 2011, there were no repurchases of our Class A common stock. During the year ended
December 31, 2010, we repurchased 6.0 million shares of our Class A common stock for $107 million in the
aggregate.
Subscriber Acquisition and Retention Costs
We incur significant upfront costs to acquire subscribers, including advertising, retailer incentives, equipment
subsidies, installation services, and new customer promotions. While we attempt to recoup these upfront costs over
the lives of their subscription, there can be no assurance that we will. We employ business rules such as minimum