Dish Network 2012 Annual Report Download - page 33
Download and view the complete annual report
Please find page 33 of the 2012 Dish Network annual report below. You can navigate through the pages in the report by either clicking on the pages listed below, or by using the keyword search tool below to find specific information within the annual report.-
 1
1 -
2
-
3
-
4
-
5
-
6
-
7
-
8
-
9
-
10
-
11
-
12
-
13
-
14
-
15
-
16
-
17
-
18
-
19
-
20
-
21
-
22
-
 23
23 -
 24
24 -
 25
25 -
 26
26 -
 27
27 -
 28
28 -
 29
29 -
 30
30 -
 31
31 -
 32
32 -
 33
33 -
 34
34 -
 35
35 -
 36
36 -
 37
37 -
 38
38 -
 39
39 -
 40
40 -
 41
41 -
 42
42 -
 43
43 -
44
-
45
-
46
-
47
-
48
-
49
-
50
-
51
-
52
-
53
-
54
-
55
-
56
-
57
-
58
-
59
-
60
-
61
-
62
-
63
-
64
-
65
-
66
-
67
-
68
-
69
-
70
-
71
-
72
-
73
-
74
-
75
-
76
-
77
-
78
-
79
-
80
-
81
-
82
-
83
-
84
-
85
-
86
-
87
-
88
-
89
-
90
-
91
-
92
-
93
-
94
-
95
 |
 |

54
54
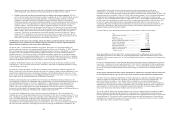
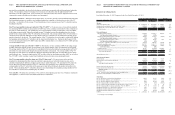
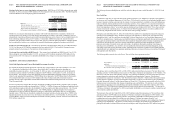
Item 6. SELECTED FINANCIAL DATA
The selected consolidated financial data as of and for each of the five years ended December 31, 2012 have been
derived from, and are qualified by reference to our Consolidated Financial Statements. Certain prior year amounts
have been reclassified to conform to the current year presentation. See further discussion under “Item 7.
Management’s Discussion and Analysis of Financial Condition and Results of Operations – Explanation of Key
Metrics and Other Items” in this Annual Report on Form 10-K. This data should be read in conjunction with our
Consolidated Financial Statements and related Notes thereto for the three years ended December 31, 2012, and
“Management’s Discussion and Analysis of Financial Condition and Results of Operations” included elsewhere in
this Annual Report.
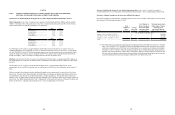
Balance Sheet Data 2012 2011 2010 2009 2008
Cash, cash equivalents and current marketable investment securities............... 7,237,777$ 2,040,853$ 2,940,377$ 2,139,336$ 559,132$
Total assets........................................................................................................ 17,379,608 11,470,231 9,632,153 8,295,34 3 6,4 60,047
Long-term debt and capital lease obligations (including current portion)......... 11,888,100 7,493,779 6,514,936 6,496,56 4 5,007,756
Total stockholders' equity (deficit).................................................................... 71,628 (419,003) (1,133,443) (2,091,688) (1,949,106)
As of December 31,
(In thousands)
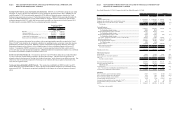
Statements of Operations Data 2012 2011 2010 2009 2008
Total revenue......................................................................................... 14,266,492$ 14,048,393$ 12,640,744$ 11,6 64,15 1$ 11,617,187$
Total costs and expenses........................................................................ 13,044,657 11,120,439 10,699,916 10,277,22 1 9,561,007
Operating income (loss)......................................................................... 1,221,835$ 2,927,954$ 1,940,828$ 1,386,930$ 2,056,180$
Net income (loss) attributable to DISH Network................................... 636,687$ 1,515,907$ 984,729$ 635,545$ 902,947$
Basic net income (loss) per share attributable to DISH Network.......... 1.41$ 3.40$ 2.21$ 1.42$ 2.01$
Diluted net income (loss) per share attributable to DISH Network....... 1.41$ 3.39$ 2.20$ 1.42$ 1.98$
Cash dividend per common share.......................................................... 1.00$ 2.00$ -$ 2.00$ -$
For the Years Ended December 31,
(In thous ands, exce pt per share amount s)
Other Data (Unaudited except for net cash flows) 2012 2011 2010 2009 2008
Pay-TV subscribers, as of period end (in millions)................................................. 14.056 13.967 14.133 14.100 13.678
Pay-TV subscriber additions, gross (in millions).................................................... 2.739 2.576 3.052 3.118 2.966
Pay-TV subscriber additions, net (in millions)....................................................... 0.089 (0.166) 0.033 0.422 (0.102)
Pay-TV average monthly subscriber churn rate...................................................... 1.57% 1.63% 1.76% 1.64% 1.86%
Pay-TV average subscriber acquisition cost per subscriber (“Pay-TV SAC”)........ 784$ 770$ NA NA NA
Pay-TV average monthly revenue per subscriber (“Pay-TV ARPU”)................... 77.10$ 76.45$ NA NA NA
Average subscriber acquisition cost per subscriber (“SAC”).................................. * 771$ 776$ 697$ 720$
Average monthly revenue per subscriber (“ARPU”)............................................. * 76.93$ 73.32$ 70.04$ 69.27$
Broadband subscribers, as of period end (in millions)............................................ 0.183 0.105 NA NA NA
Broadband subscriber additions, gross (in millions)............................................... 0.121 0.030 NA NA NA
Broadband subscriber additions, net (in millions).................................................. 0.078 (0.005) NA NA NA
Net cash flows from (in thousands):
Operating activities............................................................................................ 2,011,875$ 2,573,878$ 2,139,802$ 2,194,543$ 2,188,344$
Investing activities............................................................................................. (3,019,214)$ (2,695,328)$ (1,477,521)$ (2,605,556)$ (1,597,471)$
Financing activities............................................................................................ 4,002,484$ 93,997$ (127,453)$ 418,283$ (1,411,841)$
For the Years Ended December 31,
* During the fourth quarter 2012, following the launch of the dishNET branded broadband services, we determined
SAC and ARPU, which combined pay-TV and certain broadband activity, no longer provided a meaningful
comparison between periods; therefore, during the fourth quarter 2012, we began providing Pay-TV SAC and Pay-TV
ARPU metrics which we believe provides a more meaningful comparison between periods. See “Explanation of Key
Metrics and Other Items” for further information.
Item 7. MANAGEMENT’S DISCUSSION AND ANALYSIS OF FINANCIAL CONDITION AND
RESULTS OF OPERATIONS
55
55
You should read the following management’s discussion and analysis of our financial condition and results of
operations together with the audited consolidated financial statements and notes to our financial statements
included elsewhere in this Annual Report. This management’s discussion and analysis is intended to help provide
an understanding of our financial condition, changes in financial condition and results of our operations and
contains forward-looking statements that involve risks and uncertainties. The forward-looking statements are not
historical facts, but rather are based on current expectations, estimates, assumptions and projections about our
industry, business and future financial results. Our actual results could differ materially from the results
contemplated by these forward-looking statements due to a number of factors, including those discussed in this
report, including under the caption “Item 1A. Risk Factors” in this Annual Report on Form 10-K.
EXECUTIVE SUMMARY
Overview
DISH added approximately 89,000 net Pay-TV subscribers during the year ended December 31, 2012, compared to
a loss of approximately 166,000 net Pay-TV subscribers during the same period in 2011. The increase versus the
same period in 2011 primarily resulted from a decrease in our average monthly Pay-TV subscriber churn rate and
higher gross new Pay-TV subscriber activations due primarily to increased advertising associated with our Hopper
set-top box. During the year ended December 31, 2012, DISH added approximately 2.739 million gross new Pay-
TV subscribers compared to approximately 2.576 million gross new Pay-TV subscribers during the same period in
2011, an increase of 6.3%.
Our gross new Pay-TV subscriber activations continue to be negatively impacted by increased competitive
pressures, including aggressive marketing and discounted promotional offers. In addition, our gross new Pay-TV
subscriber activations continue to be adversely affected by sustained economic weakness and uncertainty.
Our average monthly Pay-TV subscriber churn rate for the year ended December 31, 2012 was 1.57% compared to
1.63% for the same period in 2011. Our Pay-TV subscriber churn rate was positively impacted in part because we
did not have a programming package price increase in the first quarter 2012, but did during the same period in 2011.
While Pay-TV subscriber churn improved compared to the same period in 2011, churn continues to be adversely
affected by the increased competitive pressures discussed above. Our Pay-TV subscriber churn rate is also impacted
by, among other things, the credit quality of previously acquired subscribers, our ability to consistently provide
outstanding customer service, the aggressiveness of competitor subscriber acquisition efforts, and our ability to
control piracy and other forms of fraud.
On September 27, 2012, we began marketing our satellite broadband service under the dishNET brand. This service
leverages advanced technology and high-powered satellites launched by Hughes and ViaSat to provide broadband
coverage nationwide. This service primarily targets approximately 15 million rural residents that are underserved,
or unserved, by wireline broadband, and provides download speeds of up to 10 Mbps. We lease the customer
premise equipment to subscribers and generally pay Hughes and ViaSat a wholesale rate per subscriber on a
monthly basis. Currently, we generally utilize our existing DISH distribution channels under similar incentive
arrangements as our pay-TV business to acquire new broadband subscribers.
In addition to the dishNET branded satellite broadband service, we also offer wireline voice and broadband services
under the dishNET brand as a competitive local exchange carrier to consumers living in a 14-state region (Arizona,
Colorado, Idaho, Iowa, Minnesota, Montana, Nebraska, New Mexico, North Dakota, Oregon, South Dakota, Utah,
Washington and Wyoming). Our dishNET branded wireline broadband service provides download speeds of up to
20 Mbps.
We primarily bundle our dishNET branded services with our DISH branded pay-TV service, to offer customers a
single bill, payment and customer service option, which includes a discount for bundled services. In addition, we
market and sell our dishNET branded services on a stand-alone basis.