Dish Network 2012 Annual Report Download - page 39
Download and view the complete annual report
Please find page 39 of the 2012 Dish Network annual report below. You can navigate through the pages in the report by either clicking on the pages listed below, or by using the keyword search tool below to find specific information within the annual report.-
 1
1 -
2
-
3
-
4
-
5
-
6
-
7
-
8
-
9
-
10
-
11
-
12
-
13
-
14
-
15
-
16
-
17
-
18
-
19
-
20
-
21
-
22
-
23
-
24
-
25
-
26
-
27
-
28
-
 29
29 -
 30
30 -
 31
31 -
 32
32 -
 33
33 -
 34
34 -
 35
35 -
 36
36 -
 37
37 -
 38
38 -
 39
39 -
 40
40 -
 41
41 -
 42
42 -
 43
43 -
 44
44 -
 45
45 -
 46
46 -
 47
47 -
 48
48 -
 49
49 -
50
-
51
-
52
-
53
-
54
-
55
-
56
-
57
-
58
-
59
-
60
-
61
-
62
-
63
-
64
-
65
-
66
-
67
-
68
-
69
-
70
-
71
-
72
-
73
-
74
-
75
-
76
-
77
-
78
-
79
-
80
-
81
-
82
-
83
-
84
-
85
-
86
-
87
-
88
-
89
-
90
-
91
-
92
-
93
-
94
-
95
 |
 |

Item 7. MANAGEMENT’S DISCUSSION AND ANALYSIS OF FINANCIAL CONDITION AND
RESULTS OF OPERATIONS - Continued
66
66
Pay-TV subscribers. DISH added approximately 89,000 net Pay-TV subscribers during the year ended December
31, 2012, compared to a loss of approximately 166,000 net Pay-TV subscribers during the same period in 2011. The
increase versus the same period in 2011 primarily resulted from a decrease in our average monthly Pay-TV
subscriber churn rate and higher gross new Pay-TV subscriber activations due primarily to increased advertising
associated with our Hopper set-top box. During the year ended December 31, 2012, DISH added approximately
2.739 million gross new Pay-TV subscribers compared to approximately 2.576 million gross new Pay-TV
subscribers during the same period in 2011, an increase of 6.3%.
Our gross new Pay-TV subscriber activations continue to be negatively impacted by increased competitive
pressures, including aggressive marketing and discounted promotional offers. Telecommunications companies have
continued to grow their pay-TV customer bases. In addition, our gross new Pay-TV subscriber activations continue
to be adversely affected by sustained economic weakness and uncertainty.
Our average monthly Pay-TV subscriber churn rate for the year ended December 31, 2012 was 1.57% compared to
1.63% for the same period in 2011. Our Pay-TV subscriber churn rate was positively impacted in part because we
did not have a programming package price increase in the first quarter 2012, but did during the same period in 2011.
While Pay-TV subscriber churn improved compared to the same period in 2011, churn continues to be adversely
affected by the increased competitive pressures discussed above. Our Pay-TV subscriber churn rate is also impacted
by, among other things, the credit quality of previously acquired subscribers, our ability to consistently provide
outstanding customer service, the aggressiveness of competitor subscriber acquisition efforts, and our ability to
control piracy and other forms of fraud.
We have not always met our own standards for performing high-quality installations, effectively resolving
subscriber issues when they arise, answering subscriber calls in an acceptable timeframe, effectively communicating
with our subscriber base, reducing calls driven by the complexity of our business, improving the reliability of certain
systems and subscriber equipment, and aligning the interests of certain third party retailers and installers to provide
high-quality service. Most of these factors have affected both gross new Pay-TV subscriber activations as well as
existing Pay-TV churn rate. Our future gross new Pay-TV subscriber activations and Pay-TV churn rate may be
negatively impacted by these factors, which could in turn adversely affect our revenue growth.
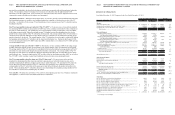
Broadband subscribers. DISH added approximately 78,000 net broadband subscribers during the year ended
December 31, 2012, compared to a loss of approximately 5,000 net broadband subscribers during the same period in
2011. This increase versus the same period in 2011 primarily resulted from higher gross new broadband subscriber
activations driven by increased advertising associated with the launch of dishNET branded broadband services.
During the year ended December 31, 2012, DISH added approximately 121,000 gross new broadband subscribers
compared to approximately 30,000 gross new broadband subscribers during the same period in 2011.
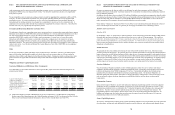
The pace of net broadband subscriber activations increased in the fourth quarter primarily driven by increased
advertising associated with the launch of dishNET branded broadband services. Of the 2012 net broadband
subscriber activations, 34,000 occurred during the nine months ended September 30, 2012 and 44,000 occurred
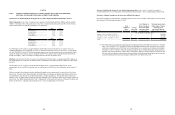
during the three months ended December 31, 2012. The following table details gross and net broadband subscriber
additions by quarter for the year ended December 31, 2012.
Broadband Subscribers
Gross
Additions
Net
Additions
First Quarter, 2012......................... 14 6
Second Quarter, 2012..................... 21 11
Third Quarter, 2012........................ 29 17
Fourth Quarter, 2012...................... 57 44
Total............................................... 121 78
(In thousands)
Subscriber-related revenue. “Subscriber-related revenue” totaled $13.086 billion for the year ended December 31,
2012, an increase of $110 million or 0.8% compared to the same period in 2011. The change in “Subscriber-related
revenue” from the previous year was primarily related to the increase in Pay-TV ARPU discussed below. Included
Item 7. MANAGEMENT’S DISCUSSION AND ANALYSIS OF FINANCIAL CONDITION AND
RESULTS OF OPERATIONS - Continued
67
67
in “Subscriber-related revenue” is $95 million and $81 million of revenue related to our broadband services for the
years ended December 31, 2012 and 2011, respectively.
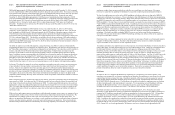
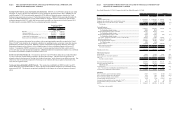
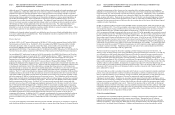
Pay-TV ARPU. “Pay-TV average monthly revenue per subscriber” was $77.10 during the year ended December 31,
2012 versus $76.45 during the same period in 2011. The $0.65 or 0.9% increase in Pay-TV ARPU was primarily
attributable to higher hardware related revenue. The following table details Pay-TV ARPU by quarter for the year
ended December 31, 2012.
Pay-TV ARPU
Pay-TV
ARPU
First Quarter, 2012......................... 76.24$
Second Quarter, 2012..................... 77.59
Third Quarter, 2012........................ 76.99
Fourth Quarter, 2012...................... 77.59
Year-to-date, 2012.......................... 77.10
Equipment and merchandise sales, rental and other revenue. “Equipment and merchandise sales, rental and other
revenue” totaled $1.163 billion for the year ended December 31, 2012, an increase of $127 million compared to the
same period in 2011. This increase was primarily driven by a full year of revenue in 2012 compared to
approximately eight months in the previous year from the rental of movies and video games, the sale of previously
rented titles, and other merchandise sold to customers including movies, video games and other items related to our
Blockbuster operations. Blockbuster operations are included in our financial results beginning April 26, 2011. This
increase was partially offset by a decline in revenue as a result of Blockbuster domestic store closings during 2012 and
2011.
Subscriber-related expenses. “Subscriber-related expenses” totaled $7.254 billion during the year ended December
31, 2012, an increase of $409 million or 6.0% compared to the same period in 2011. The increase in “Subscriber-
related expenses” was primarily attributable to higher programming costs. The increase in programming costs was
driven by rate increases in certain of our programming contracts, including the renewal of certain contracts at higher
rates. During the fourth quarter 2012, $6 million of expenses related to the acquisition of broadband subscribers for
the period beginning January 1, 2012 through September 30, 2012 that were previously included in “Subscriber-
related expenses” were reclassified to “Subscriber acquisition costs.” These amounts associated with our broadband
services for 2011 were immaterial. “Subscriber-related expenses” represented 55.4% and 52.8% of “Subscriber-
related revenue” during the year ended December 31, 2012 and 2011, respectively. The change in this expense to
revenue ratio primarily resulted from higher programming costs, discussed above.
In the normal course of business, we enter into contracts to purchase programming content in which our payment
obligations are fully contingent on the number of subscribers to whom we provide the respective content. Our
programming expenses will continue to increase to the extent we are successful in growing our subscriber base. In
addition, our “Subscriber-related expenses” may face further upward pressure from price increases and the renewal of
long-term programming contracts on less favorable pricing terms.
Cost of sales – equipment, merchandise, services, rental and other. “Cost of sales – equipment, merchandise,
services, rental and other” totaled $570 million for the year ended December 31, 2012, an increase of $121 million
compared to the same period in 2011. This increase was primarily driven by a full year of expense in 2012
compared to approximately eight months in the previous year of rental title purchases or revenue sharing to studios,
packaging and on-line delivery costs as well as the cost of merchandise sold such as movies, video games and other
items related to our Blockbuster operations. In addition, our “Cost of sales – equipment, merchandise, services, rental
and other” was adversely impacted by a charge of $21 million as a result of the Blockbuster UK Administration, and
higher inventory costs per unit during the year ended December 31, 2012 compared to the fair value of the inventory
costs per unit acquired in the Blockbuster Acquisition which were expensed during the prior period. See Note 10 in
the Notes to the Consolidated Financial Statements in Item 15 of this Annual Report on Form 10-K for further
discussion. These increases were partially offset by a decline in expense as a result of Blockbuster domestic store
closings during 2012 and 2011. Blockbuster operations are included in our financial results beginning April 26, 2011.