Dish Network 2012 Annual Report Download - page 66
Download and view the complete annual report
Please find page 66 of the 2012 Dish Network annual report below. You can navigate through the pages in the report by either clicking on the pages listed below, or by using the keyword search tool below to find specific information within the annual report.-
 1
1 -
2
-
3
-
4
-
5
-
6
-
7
-
8
-
9
-
10
-
11
-
12
-
13
-
14
-
15
-
16
-
17
-
18
-
19
-
20
-
21
-
22
-
23
-
24
-
25
-
26
-
27
-
28
-
29
-
30
-
31
-
32
-
33
-
34
-
35
-
36
-
37
-
38
-
39
-
40
-
41
-
42
-
43
-
44
-
45
-
46
-
47
-
48
-
49
-
50
-
51
-
52
-
53
-
54
-
55
-
 56
56 -
 57
57 -
 58
58 -
 59
59 -
 60
60 -
 61
61 -
 62
62 -
 63
63 -
 64
64 -
 65
65 -
 66
66 -
 67
67 -
 68
68 -
 69
69 -
 70
70 -
 71
71 -
 72
72 -
 73
73 -
 74
74 -
 75
75 -
 76
76 -
77
-
78
-
79
-
80
-
81
-
82
-
83
-
84
-
85
-
86
-
87
-
88
-
89
-
90
-
91
-
92
-
93
-
94
-
95
 |
 |

DISH NETWORK CORPORATION
NOTES TO CONSOLIDATED FINANCIAL STATEMENTS - Continued
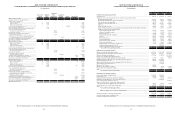
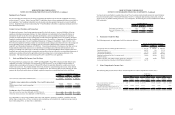
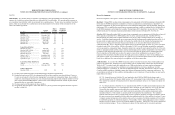
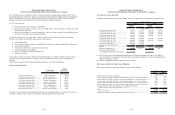
Marketable Investment Securities in a Loss Position
The following table reflects the length of time that the individual securities, accounted for as available-for-sale, have
been in an unrealized loss position, aggregated by investment category. As of December 31, 2012, the unrealized
losses on our investments in equity securities represent investments in broad-based indexes and companies in the
telecommunications and technology industries. We are not aware of any specific factors which indicate the
unrealized losses in these investments are due to anything other than temporary market fluctuations. As of
December 31, 2012 and 2011, the unrealized losses on our investments in debt securities primarily represent
investments in ARS. We have the ability to hold and do not intend to sell our investments in these debt securities
before they recover or mature, and it is more likely than not that we will hold these investments until that time. In
addition, we are not aware of any specific factors indicating that the underlying issuers of these debt securities
would not be able to pay interest as it becomes due or repay the principal at maturity. Therefore, we believe that
these changes in the estimated fair values of these marketable investment securities are related to temporary market
fluctuations.
Fair Unrealized Fair Unrealized
Value Loss Value Loss
(In thousands)
Debt Securities:
Less than 12 months... 761,551$ (909)$ 694,199$ (4,793)$
12 months or more...... 72,395 (8,327) 98,240 (16,258)
Equity Securities:
Less than 12 months... 154,566 (11,537) 247,683 (61,934)
12 months or more...... - - - -
Total.............................. 988,512$ (20,773)$ 1,040,122$ (82,985)$
As of December 31,
2012 2011
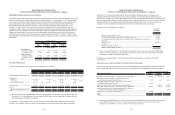
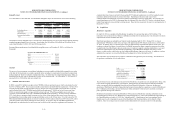
Fair Value Measurements
Our investments measured at fair value on a recurring basis were as follows:
Total Level 1Level 2Level 3Total Level 1Level 2Level 3
(In thousands)
Cash Equivalents (including restricted)....... 3,386,929$ 67,833$ 3,319,096$ -$ 397,777$ 46,371$ 351,406$ -$
Debt securities:
VRDNs......................................................... 130,306$ -$ 130,306$ -$ 160,555$ -$ 160,555$ -$
ARS and other.............................................. 106,172 - 955 105,217 109,327 - 3,412 105,915
Other (including restricted)......................... 3,287,317 11,182 3,276,135 - 994,021 - 994,021 -
Equity securities............................................. 265,380 265,380 - - 343,012 343,012 - -
Subtotal........................................................... 3,789,175 276,562 3,407,396 10 5,217 1,606,915 343,012 1,157,988 105,915
Investment in DBSD North America (1)...... - - - - 839,009 - - 839,009
Total................................................................. 3,789,175$ 2 76,562$ 3,407,396$ 105,217$ 2,445,924$ 343,012$ 1,157,988$ 944,924$
As of
December 31, 2012 December 31, 2011
(1) Of our total investment in DBSD North America of $1.298 billion as of December 31, 2011, $839 million was
invested in 7.5% Convertible Senior Secured Notes due 2009, which were accounted for as available-for-sale
investments prior to the DBSD Transaction.
As December 31, 2012 and 2011, our Level 3 investments consist predominately of ARS and other investment
securities. On a quarterly basis we evaluate the reasonableness of significant unobservable inputs used in those
F-22
DISH NETWORK CORPORATION
NOTES TO CONSOLIDATED FINANCIAL STATEMENTS - Continued
measurements. The valuation models used for some of our ARS investments require an evaluation of the
underlying instruments held by the trusts that issue these securities. For our other ARS and other investment
securities, our evaluation uses, among other things, the terms of the underlying instruments, the credit ratings of the
issuers, current market conditions, and other relevant factors. Based on these factors, we assess the risk of realizing
expected cash flows and we apply an observable discount rate that reflects this risk. We may also reduce our
valuations to reflect a liquidity discount based on the lack of an active market for these securities.
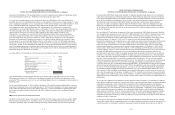
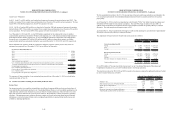
Changes in Level 3 instruments are as follows:
Level 3
Investmen t
Securities
(In thousands)
Balance as of December 31, 2011............................................................................................... 944,924$
Net realized and unrealized gains (losses) included in earnings................................................... 78,650
Net realized and unrealized gains (losses) included in other comprehensive income (loss)......... (71,746)
Purchases...................................................................................................................................... -
Settlements (1).............................................................................................................................. (846,611)
Issuances....................................................................................................................................... -
Transfers from level 2 to level 3................................................................................................... -
Balance as of December 31, 2012............................................................................................... 105,217$
(1) For the year ended December 31, 2012, this amount primarily relates to the conversion of our DBSD North
America 7.5% Convertible Senior Secured Notes due 2009 in connection with the completion of the DBSD
Transaction. See Note 10 for further information.
During the year ended December 31, 2012, we had no transfers in and out of Level 1 and Level 2 fair value
measurements.
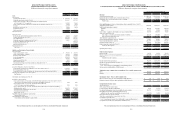
Gains and Losses on Sales and Changes in Carrying Values of Investments
“Other, net” income and expense included on our Consolidated Statements of Operations and Comprehensive Income
(Loss) includes other changes in the carrying amount of our marketable and non-marketable investments as follows:
Other Income (Expense): 2012 2011 2010
Marketable investment securities - gains (losses) on sales/exchanges.................................. $ 120,558 $ 14,313 $ 13,277
Marketable investment securities - unrealized gains (losses)
on investments accounted for at fair value....................................................................... 1,331 263 8,371
Marketable investment securities - gains (losses) on conversion
of DBSD North America Notes (1).................................................................................. 99,445 - -
Other investment securities - gains (losses) on sales/exchanges........................................... - 10,000 21,422
Marketable investment securities - other-than-temporary impairments................................ (49,020) (16,557) (12,734)
Other investment securities - unrealized gains (losses) on fair value
investments and other-than-temporary impairments......................................................... - - 3,361
Impairment of receivable from Blockbuster UK................................................................... (25,000) - -
Other..................................................................................................................................... 977 (1,833) (2,701)
Total..................................................................................................................................... 148,291$ 6,186$ 30,996$
For the Years Ended December 31,
(In thousands)
(1) During the year ended December 31, 2012, we recognized a $99 million non-cash gain related to the conversion
of our DBSD North America 7.5% Convertible Senior Secured Notes due 2009 in connection with the
completion of the DBSD Transaction. See Note 10 for further information.
F-23