Dish Network 2012 Annual Report Download - page 65
Download and view the complete annual report
Please find page 65 of the 2012 Dish Network annual report below. You can navigate through the pages in the report by either clicking on the pages listed below, or by using the keyword search tool below to find specific information within the annual report.-
 1
1 -
2
-
3
-
4
-
5
-
6
-
7
-
8
-
9
-
10
-
11
-
12
-
13
-
14
-
15
-
16
-
17
-
18
-
19
-
20
-
21
-
22
-
23
-
24
-
25
-
26
-
27
-
28
-
29
-
30
-
31
-
32
-
33
-
34
-
35
-
36
-
37
-
38
-
39
-
40
-
41
-
42
-
43
-
44
-
45
-
46
-
47
-
48
-
49
-
50
-
51
-
52
-
53
-
54
-
 55
55 -
 56
56 -
 57
57 -
 58
58 -
 59
59 -
 60
60 -
 61
61 -
 62
62 -
 63
63 -
 64
64 -
 65
65 -
 66
66 -
 67
67 -
 68
68 -
 69
69 -
 70
70 -
 71
71 -
 72
72 -
 73
73 -
 74
74 -
 75
75 -
76
-
77
-
78
-
79
-
80
-
81
-
82
-
83
-
84
-
85
-
86
-
87
-
88
-
89
-
90
-
91
-
92
-
93
-
94
-
95
 |
 |

DISH NETWORK CORPORATION
NOTES TO CONSOLIDATED FINANCIAL STATEMENTS - Continued
The valuation of our ARS and other investment securities investments portfolio is subject to uncertainties that are
difficult to estimate. Due to the lack of observable market quotes for identical assets, we utilize analyses that rely
on Level 2 and/or Level 3 inputs, as defined in “Fair Value Measurements.” These inputs include, among other
things, observed prices on similar assets as well as our assumptions and estimates related to the counterparty credit
quality, default risk underlying the security and overall capital market liquidity. These securities were also
compared, when possible, to other observable market data for financial instruments with similar characteristics.
Fair Value Election. As of December 31, 2012, our ARS and other noncurrent marketable investment securities
portfolio of $106 million includes $62 million of securities accounted for under the fair value method. In March
2010, the FASB issued Accounting Standards Update 2010-11 (“ASU 2010-11”), Derivatives and Hedging: Scope
Exception Related to Embedded Credit Derivatives. ASU 2010-11 clarifies the type of embedded credit derivative that
is exempt from certain bifurcation requirements. Only one form of embedded credit derivative qualifies for the
exemption - one that is related to the subordination of one financial instrument to another. As a result, entities that have
contracts containing an embedded credit derivative feature in a form other than subordination may need to separately
account for the embedded credit derivative feature. On July 1, 2010, we elected to apply the fair value option to
certain of our ARS portfolio impacted by ASU 2010-11. As a result, we recorded a $50 million loss, net of tax,
which is included as a cumulative-effect adjustment to “Accumulated earnings (deficit).” All changes in the fair
value of these investments after June 30, 2010 are recognized in our results of operations and included in “Other,
net” income and expense on our Consolidated Statements of Operations and Comprehensive Income (Loss) and
detailed in the table titled “Gains and Losses on Sales and Changes in Carrying Value of Investments” below.
Other Investment Securities
We have strategic investments in certain debt and equity securities that are included in noncurrent “Marketable and
other investment securities” on our Consolidated Balance Sheets and accounted for using the cost, equity and/or fair
value methods of accounting.
Our ability to realize value from our strategic investments in companies that are not publicly traded depends on the
success of those companies’ businesses and their ability to obtain sufficient capital, on acceptable terms or at all, to
execute their business plans. Because private markets are not as liquid as public markets, there is also increased risk
that we will not be able to sell these investments, or that when we desire to sell them we will not be able to obtain
fair value for them.
F-20
DISH NETWORK CORPORATION
NOTES TO CONSOLIDATED FINANCIAL STATEMENTS - Continued
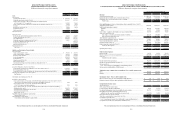
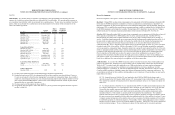
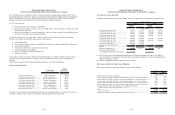
Unrealized Gains (Losses) on Marketable Investment Securities
As of December 31, 2012 and 2011, we had accumulated net unrealized gains of $194 million and $91 million, both net
of related tax effect, respectively, as a part of “Accumulated other comprehensive income (loss)” within “Total
stockholders’ equity (deficit).” The components of our available-for-sale investments are summarized in the table
below.
Marketable Marketable
Investment In ves tment
Securities Gains Losses Net Securities Gains Losses Net
Debt securities:
VRDNs.......................................................... 130,306$ -$ -$ -$ 160,555$ -$ -$ -$
ARS and other............................................... 43,921 1,375 (8,033) (6,658) 46,657 848 (14,486) (13,638)
ARS fair value election................................. 62,251 - - - 62,670 - - -
Other (including restricted)........................... 3,287,317 208,208 (1,203) 20 7,00 5 994,021 5,526 (6,565) (1,039)
Equity securities:
Other............................................................. 265,380 17,918 (11,537) 6,381 343,012 89,044 (61,934) 27,110
Subtotal............................................................ 3,789,175 227,501 (20,773) 20 6,728 1,606,915 95,418 (82,985) 12,433
Investment in DBSD North America (1)....... - - - - 839,009 78,749 - 78,749
Total................................................................. 3,789,175$ 227,501$ (20,773)$ 206,728$ 2,445,924$ 174,167$ (82,985)$ 91,182$
As of December 31,
(In thousands)
Unrealized
2012
Unrealized
2011
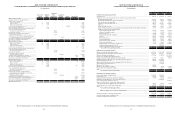
(1) Of our total investment in DBSD North America of $1.298 billion as of December 31, 2011, $839 million was
invested in 7.5% Convertible Senior Secured Notes due 2009, which were accounted for as available-for-sale
investments prior to the DBSD Transaction.
As of December 31, 2012, restricted and non-restricted marketable investment securities include debt securities of
$1.961 billion with contractual maturities within one year, $1.386 billion with contractual maturities after one year
through five years and $177 million with contractual maturities after ten years. Actual maturities may differ from
contractual maturities as a result of our ability to sell these securities prior to maturity.
F-21