Dish Network 2012 Annual Report Download - page 38
Download and view the complete annual report
Please find page 38 of the 2012 Dish Network annual report below. You can navigate through the pages in the report by either clicking on the pages listed below, or by using the keyword search tool below to find specific information within the annual report.-
 1
1 -
2
-
3
-
4
-
5
-
6
-
7
-
8
-
9
-
10
-
11
-
12
-
13
-
14
-
15
-
16
-
17
-
18
-
19
-
20
-
21
-
22
-
23
-
24
-
25
-
26
-
27
-
 28
28 -
 29
29 -
 30
30 -
 31
31 -
 32
32 -
 33
33 -
 34
34 -
 35
35 -
 36
36 -
 37
37 -
 38
38 -
 39
39 -
 40
40 -
 41
41 -
 42
42 -
 43
43 -
 44
44 -
 45
45 -
 46
46 -
 47
47 -
 48
48 -
49
-
50
-
51
-
52
-
53
-
54
-
55
-
56
-
57
-
58
-
59
-
60
-
61
-
62
-
63
-
64
-
65
-
66
-
67
-
68
-
69
-
70
-
71
-
72
-
73
-
74
-
75
-
76
-
77
-
78
-
79
-
80
-
81
-
82
-
83
-
84
-
85
-
86
-
87
-
88
-
89
-
90
-
91
-
92
-
93
-
94
-
95
 |
 |

Item 7. MANAGEMENT’S DISCUSSION AND ANALYSIS OF FINANCIAL CONDITION AND
RESULTS OF OPERATIONS - Continued
64
64
previously been included in the described calculation, could be more accurately reflected through actual subscriber
counts. The net impact of these two changes was to increase our subscriber count by approximately 6,000
subscribers in the first quarter 2011. Prior period Pay-TV subscriber counts have not been adjusted for this revised
commercial accounts calculation as the impacts were immaterial.
“Broadband subscribers.” During the fourth quarter 2012, we elected to provide certain broadband subscriber data.
Each broadband customer is counted as one broadband subscriber, regardless of whether they are also a Pay-TV
subscriber. A subscriber of both our pay-TV and broadband services is counted as one Pay-TV subscriber and one
broadband subscriber.
Pay-TV average monthly revenue per subscriber (“Pay-TV ARPU”). We are not aware of any uniform standards
for calculating ARPU and believe presentations of ARPU may not be calculated consistently by other companies in
the same or similar businesses. We calculate Pay-TV average monthly revenue per subscriber, or Pay-TV ARPU,
by dividing average monthly “Subscriber-related revenue,” excluding revenue from broadband services, for the
period by our average number of Pay-TV subscribers for the period. The average number of Pay-TV subscribers is
calculated for the period by adding the average number of Pay-TV subscribers for each month and dividing by the
number of months in the period. The average number of Pay-TV subscribers for each month is calculated by adding
the beginning and ending Pay-TV subscribers for the month and dividing by two. During the fourth quarter 2012,
we have elected to provide Pay-TV ARPU rather than APRU, defined below, as we believe Pay-TV ARPU provides
a more meaningful metric.
Average monthly revenue per subscriber (“ARPU”). Historically, we have calculated ARPU by dividing average
monthly “Subscriber-related revenue” for the period by our average number of Pay-TV subscribers for the period.
The average number of Pay-TV subscribers was calculated for the period by adding the average number of Pay-TV
subscribers for each month and dividing by the number of months in the period. The average number of Pay-TV
subscribers for each month was calculated by adding the beginning and ending Pay-TV subscribers for the month
and dividing by two. During the fourth quarter 2012, we have elected to discontinue providing ARPU as we believe
Pay-TV ARPU, which excludes revenue from broadband services, provides a more meaningful metric.
Pay-TV average monthly subscriber churn rate (“Pay-TV churn rate”). We are not aware of any uniform
standards for calculating subscriber churn rate and believe presentations of subscriber churn rates may not be
calculated consistently by different companies in the same or similar businesses. We calculate Pay-TV churn rate
for any period by dividing the number of Pay-TV subscribers who terminated service during the period by the
average number of Pay-TV subscribers for the same period, and further dividing by the number of months in the
period. When calculating Pay-TV subscriber churn, the same methodology for calculating average number of Pay-
TV subscribers is used as when calculating Pay-TV ARPU.
Free cash flow. We define free cash flow as “Net cash flows from operating activities” less “Purchases of property
and equipment,” as shown on our Consolidated Statements of Cash Flows.
Item 7. MANAGEMENT’S DISCUSSION AND ANALYSIS OF FINANCIAL CONDITION AND
RESULTS OF OPERATIONS - Continued
65
65
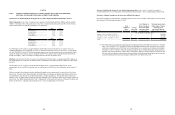
RESULTS OF OPERATIONS
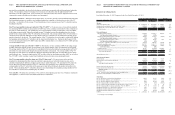
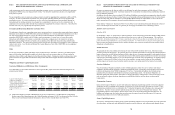
Year Ended December 31, 2012 Compared to the Year Ended December 31, 2011.
For the Years Ended December 31, Variance
Statements of Operations Data 2012 2011 Amount %
(In thousands)
Revenue:
Subscriber-related revenue........................................................................................... 13,085,910$ 12,976,009$ 109,901$ 0.8
Equipment and merchandise sales, rental and other revenue........................................ 1,162,664 1,035,910 126,754 12.2
Equipment sales, services and other revenue - EchoStar.............................................. 17,918 36,474 (18,556) (50.9)
Total revenue......................................................................................................... 14,266,492 14,048,393 218,099 1.6
Costs and Expenses:
Subscriber-related expenses...................................................................................... 7,254,458 6,845,611 408,847 6.0
% of Subscriber-related revenue.................................................................... 55.4% 52.8%
Satellite and transmission expenses - EchoStar......................................................... 424,543 441,541 (16,998) (3.8)
% of Subscriber-related revenue.................................................................... 3.2% 3.4%
Satellite and transmission expenses - Other............................................................... 41,697 39,806 1,891 4.8
% of Subscriber-related revenue.................................................................... 0.3% 0.3%
Cost of sales - equipment, merchandise, services, rental and other .......................... 569,626 448,686 120,940 27.0
Subscriber acquisition costs...................................................................................... 1,687,327 1,505,177 182,150 12.1
General and administrative expenses......................................................................... 1,353,500 1,234,494 119,006 9.6
% of Total revenue........................................................................................... 9.5% 8.8%
Litigation expense..................................................................................................... 730,457 (316,949) 1,047,406 *
Depreciation and amortization................................................................................... 983,049 922,073 60,976 6.6
Total costs and expenses....................................................................................... 13,044,657 11,120,439 1,924,218 17.3
Operating income (loss)............................................................................................... 1,221,835 2,927,954 (1,706,119) (58.3)
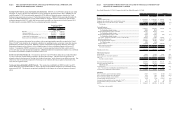
Other Income (Expense):
Interest income............................................................................................................. 99,522 34,354 65,168 *
Interest expense, net of amounts capitalized................................................................. (536,879) (557,910) 21,031 3.8
Other, net...................................................................................................................... 148,291 6,186 142,105 *
Total other income (expense)................................................................................ (289,066) (517,370) 228,304 44.1
Income (loss) before income taxes............................................................................... 932,769 2,410,584 (1,477,815) (61.3)
Income tax (provision) benefit, net............................................................................... (307,029) (895,006) 587,977 65.7
Effective tax rate ................................................................................................. 32.9% 37.1%
Net income (loss).......................................................................................................... 625,740 1,515,578 (889,838) (58.7)
Less: Net income (loss) attributable to noncontrolling interest............................... (10,947) (329) (10,618) *
Net income (loss) attributable to DISH Network......................................................... 636,687$ 1,515,907$ (879,220)$ (58.0)
Other Data:
Pay-TV subscribers, as of period end (in millions)...................................................... 14.056 13.967 0.089 0.6
Pay-TV subscriber additions, gross (in millions)......................................................... 2.739 2.576 0.163 6.3
Pay-TV subscriber additions, net (in millions)............................................................. 0.089 (0.166) 0.255 *
Pay-TV average monthly subscriber churn rate........................................................... 1.57% 1.63% (0.06%) (3.7)
Pay-TV average subscriber acquisition cost per subscriber (“Pay-TV SAC”)............. 784$ 770$ 14$ 1.8
Pay-TV average monthly revenue per subscriber (“Pay-TV ARPU”)......................... 77.10$ 76.45$ 0.65$ 0.9
Broadband subscribers, as of period end (in millions)................................................. 0.183 0.105 0.078 74.3
Broadband subscriber additions, gross (in millions).................................................... 0.121 0.030 0.091 *
Broadband subscriber additions, net (in millions)........................................................ 0.078 (0.005) 0.083 *
EBITDA....................................................................................................................... 2,364,122$ 3,856,542$ (1,492,420)$ (38.7)
* Percentage is not meaningful.