Dish Network 2012 Annual Report Download - page 41
Download and view the complete annual report
Please find page 41 of the 2012 Dish Network annual report below. You can navigate through the pages in the report by either clicking on the pages listed below, or by using the keyword search tool below to find specific information within the annual report.-
 1
1 -
2
-
3
-
4
-
5
-
6
-
7
-
8
-
9
-
10
-
11
-
12
-
13
-
14
-
15
-
16
-
17
-
18
-
19
-
20
-
21
-
22
-
23
-
24
-
25
-
26
-
27
-
28
-
29
-
30
-
 31
31 -
 32
32 -
 33
33 -
 34
34 -
 35
35 -
 36
36 -
 37
37 -
 38
38 -
 39
39 -
 40
40 -
 41
41 -
 42
42 -
 43
43 -
 44
44 -
 45
45 -
 46
46 -
 47
47 -
 48
48 -
 49
49 -
 50
50 -
 51
51 -
52
-
53
-
54
-
55
-
56
-
57
-
58
-
59
-
60
-
61
-
62
-
63
-
64
-
65
-
66
-
67
-
68
-
69
-
70
-
71
-
72
-
73
-
74
-
75
-
76
-
77
-
78
-
79
-
80
-
81
-
82
-
83
-
84
-
85
-
86
-
87
-
88
-
89
-
90
-
91
-
92
-
93
-
94
-
95
 |
 |

Item 7. MANAGEMENT’S DISCUSSION AND ANALYSIS OF FINANCIAL CONDITION AND
RESULTS OF OPERATIONS - Continued
70
70
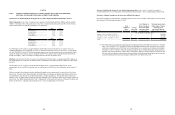
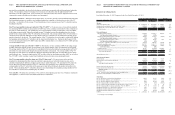
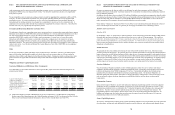
Earnings before interest, taxes, depreciation and amortization. EBITDA was $2.364 billion during the year ended
December 31, 2012, a decrease of $1.492 billion or 38.7% compared to the same period in 2011. EBITDA for year
ended December 31, 2012 was unfavorably impacted by $730 million of litigation expense related to the Voom
Settlement Agreement and an increase in “Subscriber-related expense.” EBITDA for the year ended December 31,
2011 was favorably impacted by the reversal of $341 million of “Litigation expense” related to the April 29, 2011
settlement agreement with TiVo, which had been previously recorded as an expense prior to the first quarter 2011.
The following table reconciles EBITDA to the accompanying financial statements.
2012 2011
EBITDA.................................................................. 2,364,122$ 3,856,542$
Interest expense, net.............................................. (437,357) (523,556)
Income tax (provision) benefit, net........................ (307,029) (895,006)
Depreciation and amortization............................... (983,049) (922,073)
Net income (loss) attributable to DISH Network..... 636,687$ 1,515,907$
For the Years Ended
December 31,
(In thousands)
EBITDA is not a measure determined in accordance with accounting principles generally accepted in the United
States (“GAAP”) and should not be considered a substitute for operating income, net income or any other measure
determined in accordance with GAAP. EBITDA is used as a measurement of operating efficiency and overall
financial performance and we believe it to be a helpful measure for those evaluating companies in the pay-TV
industry. Conceptually, EBITDA measures the amount of income generated each period that could be used to
service debt, pay taxes and fund capital expenditures. EBITDA should not be considered in isolation or as a substitute
for measures of performance prepared in accordance with GAAP.
Income tax (provision) benefit, net. Our income tax provision was $307 million during the year ended December
31, 2012, a decrease of $588 million compared to the same period in 2011. The decrease in the provision was
primarily related to the decrease in “Income (loss) before income taxes” and a decrease in our effective tax rate. Our
effective tax rate was positively impacted by the change in our valuation allowances against certain deferred tax
assets that are capital in nature.
Net income (loss) attributable to DISH Network. “Net income (loss) attributable to DISH Network” was $637
million during the year ended December 31, 2012, a decrease of $879 million compared to $1.516 billion for the
same period in 2011. The decrease was primarily attributable to the changes in revenue and expenses discussed
above.
Item 7. MANAGEMENT’S DISCUSSION AND ANALYSIS OF FINANCIAL CONDITION AND
RESULTS OF OPERATIONS - Continued
71
71
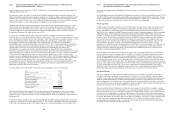
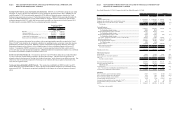
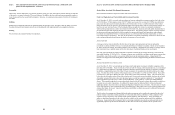
Year Ended December 31, 2011 Compared to the Year Ended December 31, 2010.
For the Years Ended December 31, Variance
Statements of Operations Data 2011 2010 Amount %
(In thousands)
Revenue:
Subscriber-related revenue................................................................................................. 12,976,009$ 12,543,794$ 432,215$ 3.4
Equipment and merchandise sales, rental and other revenue.............................................. 1,035,910 59,770 976,140 *
Equipment sales, services and other revenue - EchoStar.................................................... 36,474 37,180 (706) (1.9)
Total revenue............................................................................................................... 14,048,393 12,640,744 1,407,649 11.1
Costs and Expenses:
Subscriber-related expenses............................................................................................. 6,845,611 6,676,145 169,466 2.5
% of Subscriber-related revenue........................................................................... 52.8% 53.2%
Satellite and transmission expenses - EchoStar............................................................... 441,541 418,358 23,183 5.5
% of Subscriber-related revenue........................................................................... 3.4% 3.3%
Satellite and transmission expenses - Other..................................................................... 39,806 40,249 (443) (1.1)
% of Subscriber-related revenue........................................................................... 0.3% 0.3%
Cost of sales - equipment, merchandise, services, rental and other................................. 448,686 76,406 372,280 *
Subscriber acquisition costs............................................................................................. 1,505,177 1,653,494 (148,317) (9.0)
General and administrative expenses............................................................................... 1,234,494 625,843 608,651 97.3
% of Total revenue................................................................................................. 8.8% 5.0%
Litigation expense............................................................................................................ (316,949) 225,456 (542,405) *
Depreciation and amortization......................................................................................... 922,073 983,965 (61,892) (6.3)
Total costs and expenses.............................................................................................. 11,120,439 10,699,916 420,523 3.9
Operating income (loss)...................................................................................................... 2,927,954 1,940,828 987,126 50.9
Other Income (Expense):
Interest income.................................................................................................................... 34,354 25,158 9,196 36.6
Interest expense, net of amounts capitalized....................................................................... (557,910) (454,777) (103,133) (22.7)
Other, net............................................................................................................................ 6,186 30,996 (24,810) (80.0)
Total other income (expense)...................................................................................... (517,370) (398,623) (118,747) (29.8)
Income (loss) before income taxes...................................................................................... 2,410,584 1,542,205 868,379 56.3
Income tax (provision) benefit, net..................................................................................... (895,006) (557,473) (337,533) (60.5)
Effective tax rate....................................................................................................... 37.1% 36.1%
Net income (loss)................................................................................................................ 1,515,578 984,732 530,846 53.9
Less: Net income (loss) attributable to noncontrolling interest..................................... (329) 3 (332) *
Net income (loss) attributable to DISH Network................................................................ 1,515,907$ 984,729$ 531,178$ 53.9
Other Data:
Pay-TV subscribers, as of period end (in millions)............................................................. 13.967 14.133 (0.166) (1.2)
Pay-TV subscriber additions, gross (in millions)................................................................ 2.576 3.052 (0.476) (15.6)
Pay-TV subscriber additions, net (in millions)................................................................... (0.166) 0.033 (0.199) *
Average monthly subscriber churn rate.............................................................................. 1.63% 1.76% (0.13%) (7.4)
Average subscriber acquisition cost per subscriber (“SAC”)............................................. 771$ 776$ (5)$ (0.6)
Average monthly revenue per subscriber (“ARPU”)......................................................... 76.93$ 73.32$ 3.61$ 4.9
EBITDA............................................................................................................................. 3,856,542$ 2,955,786$ 900,756$ 30.5
* Percentage is not meaningful.