Dish Network 2012 Annual Report Download - page 40
Download and view the complete annual report
Please find page 40 of the 2012 Dish Network annual report below. You can navigate through the pages in the report by either clicking on the pages listed below, or by using the keyword search tool below to find specific information within the annual report.-
 1
1 -
2
-
3
-
4
-
5
-
6
-
7
-
8
-
9
-
10
-
11
-
12
-
13
-
14
-
15
-
16
-
17
-
18
-
19
-
20
-
21
-
22
-
23
-
24
-
25
-
26
-
27
-
28
-
29
-
 30
30 -
 31
31 -
 32
32 -
 33
33 -
 34
34 -
 35
35 -
 36
36 -
 37
37 -
 38
38 -
 39
39 -
 40
40 -
 41
41 -
 42
42 -
 43
43 -
 44
44 -
 45
45 -
 46
46 -
 47
47 -
 48
48 -
 49
49 -
 50
50 -
51
-
52
-
53
-
54
-
55
-
56
-
57
-
58
-
59
-
60
-
61
-
62
-
63
-
64
-
65
-
66
-
67
-
68
-
69
-
70
-
71
-
72
-
73
-
74
-
75
-
76
-
77
-
78
-
79
-
80
-
81
-
82
-
83
-
84
-
85
-
86
-
87
-
88
-
89
-
90
-
91
-
92
-
93
-
94
-
95
 |
 |

Item 7. MANAGEMENT’S DISCUSSION AND ANALYSIS OF FINANCIAL CONDITION AND
RESULTS OF OPERATIONS - Continued
68
68
Subscriber acquisition costs. “Subscriber acquisition costs” totaled $1.687 billion for the year ended December 31,
2012, an increase of $182 million or 12.1% compared to the same period in 2011. This increase was primarily
attributable to the increase in gross new subscriber activations and SAC described below. The $1.687 billion of
subscriber acquisition costs includes $6 million of expenses related to our broadband services for the period beginning
January 1, 2012 through September 30, 2012 that were previously included in “Subscriber-related expenses” and
were reclassified to “Subscriber acquisition costs.” These amounts associated with our broadband services for 2011
were immaterial.
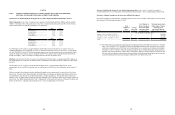
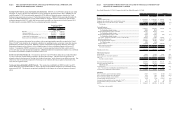
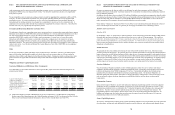
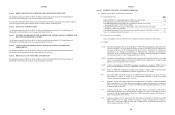
Pay-TV SAC. Pay-TV SAC was $784 during the year ended December 31, 2012 compared to $770 during the same
period in 2011, an increase of $14 or 1.8%. This increase was primarily attributable to increased advertising associated
with our Hopper set-top box. The following table details Pay-TV SAC by quarter for the year ended December 31,
2012.
Pay-TV SAC
Pay-TV
SAC
First Quarter, 2012......................... 747$
Second Quarter, 2012..................... 800
Third Quarter, 2012........................ 797
Fourth Quarter, 2012...................... 791
Year-to-date, 2012.......................... 784
During the years ended December 31, 2012 and 2011, the amount of equipment capitalized under our lease program
for new Pay-TV subscribers totaled $506 million and $480 million, respectively. This increase in capital expenditures
under our lease program for new Pay-TV subscribers resulted primarily from an increase in gross new Pay-TV
subscribers. Capital expenditures resulting from our equipment lease program for new Pay-TV subscribers were
partially mitigated by the redeployment of equipment returned by disconnecting lease program Pay-TV subscribers.
To remain competitive we upgrade or replace subscriber equipment periodically as technology changes, and the
costs associated with these upgrades may be substantial. To the extent technological changes render a portion of our
existing equipment obsolete, we would be unable to redeploy all returned equipment and consequently would realize
less benefit from the Pay-TV SAC reduction associated with redeployment of that returned lease equipment.
Our Pay-TV SAC calculation does not reflect any benefit from payments we received in connection with equipment
not returned to us from disconnecting lease subscribers and returned equipment that is made available for sale or
used in our existing customer lease program rather than being redeployed through our new customer lease program.
During the years ended December 31, 2012 and 2011, these amounts totaled $140 million and $96 million,
respectively.
We have been deploying receivers that utilize 8PSK modulation technology and receivers that utilize MPEG-4
compression technology for several years. These technologies, when fully deployed, will allow more programming
channels to be carried over our existing satellites. Many of our customers today, however, do not have receivers that
use MPEG-4 compression and a smaller but still significant number do not have receivers that use 8PSK
modulation. We may choose to invest significant capital to accelerate the conversion of customers to MPEG-4
and/or 8PSK to realize the bandwidth benefits sooner. In addition, given that all of our HD content is broadcast in
MPEG-4, any growth in HD penetration will naturally accelerate our transition to these newer technologies and may
increase our subscriber acquisition and retention costs. All new receivers that we purchase from EchoStar have
MPEG-4 technology. Although we continue to refurbish and redeploy MPEG-2 receivers, as a result of our HD
initiatives and current promotions, we currently activate most new customers with higher priced MPEG-4
technology. This limits our ability to redeploy MPEG-2 receivers and, to the extent that our promotions are
successful, will accelerate the transition to MPEG-4 technology, resulting in an adverse effect on our SAC.
Our “Subscriber acquisition costs” and “Pay-TV SAC” may materially increase in the future to the extent that we
transition to newer technologies, introduce more aggressive promotions, or provide greater equipment subsidies. See
further discussion under “Other Liquidity Items – Subscriber Acquisition and Retention Costs.”
Item 7. MANAGEMENT’S DISCUSSION AND ANALYSIS OF FINANCIAL CONDITION AND
RESULTS OF OPERATIONS - Continued
69
69
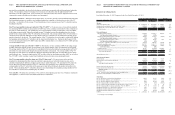
General and administrative expenses. “General and administrative expenses” totaled $1.354 billion during the year
ended December 31, 2012, a $119 million or 9.6% increase compared to the same period in 2011. This increase was
primarily due to increased personnel and infrastructure expenses for DISH Network and the inclusion of twelve months
of costs in 2012 for personnel, building and maintenance and other administrative costs associated with our
Blockbuster operations compared to eight months during the previous year. Blockbuster operations are included in our
financial results beginning April 26, 2011.
Litigation expense. “Litigation expense” related to legal settlements, judgments or accruals associated with certain
significant litigation totaled $730 million during the year ended December 31, 2012 related to the Voom Settlement
Agreement. During the year ended December 31, 2011, “Litigation expense” totaled a negative $317 million.
During the year ended December 31, 2011, we reversed $341 million related to the April 29, 2011 settlement
agreement with TiVo, which was previously recorded as an expense. See Note 16 and Note 20 in the Notes to our
Consolidated Financial Statements in Item 15 of this Annual Report on Form 10-K for further discussion.
Depreciation and amortization. “Depreciation and amortization” expense totaled $983 million during the year ended
December 31, 2012, a $61 million or 6.6% increase compared to the same period in 2011. This change in
“Depreciation and amortization” expense was primarily due to $68 million of depreciation expense related to the 148
degree orbital location in 2012 and an increase in depreciation expense associated with additional assets which were
placed in service to support DISH Network, partially offset by a decrease in depreciation expense on equipment
leased to subscribers. See Note 8 in the Notes to the Consolidated Financial Statements in Item 15 of this Annual
Report on Form 10-K for further discussion.
Interest income. “Interest income” totaled $100 million during the year ended December 31, 2012, an increase of $65
million compared to the same period in 2011. This increase principally resulted from higher percentage returns earned
on our cash and marketable investment securities and higher average cash and marketable investment securities
balances during the year ended December 31, 2012.
Interest expense, net of amounts capitalized. “Interest expense, net of amounts capitalized” totaled $537 million
during the year ended December 31, 2012, a decrease of $21 million or 3.8% compared to the same period in 2011.
This change primarily resulted from capitalized interest of $106 million related to our wireless spectrum, partially
offset by the net interest expense associated with the issuances and redemption of our senior notes during 2012 and
2011.
Other, net. “Other, net” income totaled $148 million during the year ended December 31, 2012, an increase of $142
million compared to the same period in 2011. This change primarily resulted from a $99 million non-cash gain related
to the conversion of our DBSD North America 7.5% Convertible Senior Secured Notes due 2009 in connection with
the completion of the DBSD Transaction during the first quarter 2012 and an increase in net gains on the sale of
marketable investment securities of $96 million, partially offset by an increase in impairment charges of $32 million
during 2012. In addition, this change was impacted by a $25 million impairment charge related to the Blockbuster
UK Administration. See Note 6 and Note 10 in the Notes to the Consolidated Financial Statements in Item 15 of
this Annual Report on Form 10-K for further discussion.