Cincinnati Bell 2009 Annual Report Download - page 96
Download and view the complete annual report
Please find page 96 of the 2009 Cincinnati Bell annual report below. You can navigate through the pages in the report by either clicking on the pages listed below, or by using the keyword search tool below to find specific information within the annual report.-
 1
1 -
2
-
3
-
4
-
5
-
6
-
7
-
8
-
9
-
10
-
11
-
12
-
13
-
14
-
15
-
16
-
17
-
18
-
19
-
20
-
21
-
22
-
23
-
24
-
25
-
26
-
27
-
28
-
29
-
30
-
31
-
32
-
33
-
34
-
35
-
36
-
37
-
38
-
39
-
40
-
41
-
42
-
43
-
44
-
45
-
46
-
47
-
48
-
49
-
50
-
51
-
52
-
53
-
54
-
55
-
56
-
57
-
58
-
59
-
60
-
61
-
62
-
63
-
64
-
65
-
66
-
67
-
68
-
69
-
70
-
71
-
72
-
73
-
74
-
75
-
76
-
77
-
78
-
79
-
80
-
81
-
82
-
83
-
84
-
85
-
 86
86 -
 87
87 -
 88
88 -
 89
89 -
 90
90 -
 91
91 -
 92
92 -
 93
93 -
 94
94 -
 95
95 -
 96
96 -
 97
97 -
 98
98 -
 99
99 -
 100
100 -
 101
101 -
 102
102 -
 103
103 -
 104
104 -
 105
105 -
 106
106 -
107
-
108
-
109
-
110
-
111
-
112
-
113
-
114
-
115
-
116
-
117
-
118
-
119
-
120
-
121
-
122
-
123
-
124
-
125
-
126
-
127
-
128
-
129
-
130
-
131
-
132
-
133
-
134
-
135
-
136
-
137
-
138
-
139
-
140
-
141
-
142
-
143
-
144
-
145
-
146
-
147
-
148
-
149
-
150
-
151
-
152
-
153
-
154
-
155
-
156
-
157
-
158
-
159
-
160
-
161
-
162
-
163
-
164
-
165
-
166
-
167
-
168
-
169
-
170
-
171
-
172
-
173
-
174
-
175
-
176
-
177
-
178
-
179
-
180
-
181
-
182
-
183
-
184
-
185
-
186
-
187
-
188
 |
 |

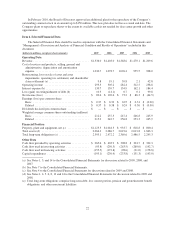
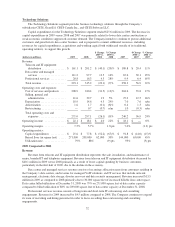
2008 Compared to 2007
Consolidated revenue totaled $1,403.0 million in 2008, an increase of $54.4 million compared to $1,348.6
million in 2007. The increase was primarily due to the following:
•$56.9 million higher revenues in the Technology Solutions segment primarily due to increased data center
and managed services revenue and telecom and IT equipment distribution revenue;
•$21.6 million higher revenues in the Wireless segment primarily due to increased postpaid service
revenue; and
•$18.1 million lower revenues in the Wireline segment due to lower voice revenue and the effect of a $9.5
million one-time business customer project in 2007 partially offset by increased data, long distance and
VoIP revenue.
Operating income for 2008 was $305.2 million, an increase of $22.8 million compared to 2007. The
increase was primarily due to the following:
•$12.5 million increase in Wireless segment operating income primarily due to higher postpaid revenue;
•$9.2 million increase in Wireline segment operating income due to lower labor costs, lower restructuring
costs and income from an operating tax settlement offset by a decline in revenue described above; and
•$1.1 million decrease in Corporate expenses due to lower expense related to incentive and deferred
compensation plans partially offset by higher expenses of $2.0 million related to a settlement of a patent
lawsuit.
Interest expense decreased to $139.7 million for 2008 compared to $154.9 million in 2007. The decrease
was primarily attributable to lower debt balances due to the purchase and extinguishment of a portion of the
Company’s corporate bonds and lower short-term interest rates.
The gain on extinguishment of debt of $14.1 million for 2008 was due to the Company’s purchase and
retirement of $108.1 million of the Company’s corporate bonds at an average discount of 14%.
Income tax expense increased from $56.7 million in 2007 to $73.6 million in 2008 primarily due to higher
pretax income. The Company used approximately $56 million of federal and state net operating loss
carryforwards to substantially defray payment of federal and state tax liabilities. As a result, the Company had
cash income tax payments of only $2.0 million in 2008.
Discussion of Operating Segment Results
Wireline
The Wireline segment provides local voice telephone service, including custom calling features, and data
services, including DSL high-speed internet access, dedicated network access, ATM — Gig-E based data
transport, and dial-up internet access to customers in southwestern Ohio, northern Kentucky, and southeastern
Indiana through the operations of CBT, an ILEC in its operating territory of an approximate 25-mile radius of
Cincinnati, Ohio. CBT’s network has full digital switching capability and can provide data transmission services
to over 96% of its in-territory access lines via DSL.
Outside of the ILEC territory, the Wireline segment provides these services through CBET, which operates
as a CLEC both in the communities north of CBT’s operating territory and in the greater Dayton market. CBET
provides voice and data services for residential and business customers on its own network and by purchasing
unbundled network elements from the ILEC. CBET provides service through UNE-L to its customer base in the
Dayton, Ohio market. The Wireline segment links the Cincinnati and Dayton geographies through its SONET,
which provides route diversity via two separate paths.
In 2009, the Company launched in limited areas its Fioptics product suite of services, which are
fiber-to-the-home products that include entertainment, high-speed internet and voice services. The Company has
focused its fiber network expenditures on high traffic areas, such as apartment complexes and business office
parks.
26