Cincinnati Bell 2009 Annual Report Download - page 8
Download and view the complete annual report
Please find page 8 of the 2009 Cincinnati Bell annual report below. You can navigate through the pages in the report by either clicking on the pages listed below, or by using the keyword search tool below to find specific information within the annual report.-
 1
1 -
 2
2 -
 3
3 -
 4
4 -
 5
5 -
 6
6 -
 7
7 -
 8
8 -
 9
9 -
 10
10 -
 11
11 -
 12
12 -
 13
13 -
 14
14 -
 15
15 -
 16
16 -
 17
17 -
 18
18 -
 19
19 -
20
-
21
-
22
-
23
-
24
-
25
-
26
-
27
-
28
-
29
-
30
-
31
-
32
-
33
-
34
-
35
-
36
-
37
-
38
-
39
-
40
-
41
-
42
-
43
-
44
-
45
-
46
-
47
-
48
-
49
-
50
-
51
-
52
-
53
-
54
-
55
-
56
-
57
-
58
-
59
-
60
-
61
-
62
-
63
-
64
-
65
-
66
-
67
-
68
-
69
-
70
-
71
-
72
-
73
-
74
-
75
-
76
-
77
-
78
-
79
-
80
-
81
-
82
-
83
-
84
-
85
-
86
-
87
-
88
-
89
-
90
-
91
-
92
-
93
-
94
-
95
-
96
-
97
-
98
-
99
-
100
-
101
-
102
-
103
-
104
-
105
-
106
-
107
-
108
-
109
-
110
-
111
-
112
-
113
-
114
-
115
-
116
-
117
-
118
-
119
-
120
-
121
-
122
-
123
-
124
-
125
-
126
-
127
-
128
-
129
-
130
-
131
-
132
-
133
-
134
-
135
-
136
-
137
-
138
-
139
-
140
-
141
-
142
-
143
-
144
-
145
-
146
-
147
-
148
-
149
-
150
-
151
-
152
-
153
-
154
-
155
-
156
-
157
-
158
-
159
-
160
-
161
-
162
-
163
-
164
-
165
-
166
-
167
-
168
-
169
-
170
-
171
-
172
-
173
-
174
-
175
-
176
-
177
-
178
-
179
-
180
-
181
-
182
-
183
-
184
-
185
-
186
-
187
-
188
 |
 |

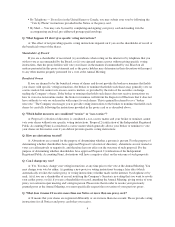
Financial Highlights
Year Ended December 31,
(dollars in millions) 2009 2008 2007
Operating Data
Revenue $1,336.0 $1,403.0 $1,348.6
Cost of services and products, selling, general and administrative,
depreciation and amortization expense 1,030.7 1,078.7 1,026.4
Restructuring, loss on sale of asset and asset impairment, and
operating tax settlement 9.8 19.1 39.8
Operating income 295.5 305.2 282.4
Interest expense 130.7 139.7 154.9
Loss (gain) on extinguishment of debt 10.3 (14.1) 0.7
Net income $ 89.6 $ 102.6 $ 73.2
Financial Position
Property, plant and equipment, net $1,123.3 $1,044.3 $ 933.7
Total assets 2,064.3 2,086.7 2,019.6
Total long-term obligations 2,395.1 2,472.2 2,369.6
These financial highlights should be read in conjunction with the Consolidated Financial Statements and “Management’s Discussion and Analysis of Financial
Condition and Results of Operations” included in the Company’s Annual Report on Form 10-K included in this document.
Safe Harbor Statement
Certain of the statements and predictions contained in these
reports constitute forward-looking statements within the
meaning of the Private Securities Litigation Reform Act. In
particular, statements, projections or estimates that include or
reference the words “believes,” “anticipates,” “plans,” “intends,”
“expects,” “will,” or any similar expression fall within the safe
harbor for forward-looking statements contained in the Reform
Act. Actual results or outcomes may differ materially from those
indicated or suggested by any such forward-looking statement
for a variety of reasons, including, but not limited to: changing
market conditions and growth rates within the
telecommunications industry or generally within the overall
economy; changes in competition in markets in which the
company operates; pressures on the pricing of company products
and services; advances in telecommunications technology; the
ability to generate sufficient cash flow to fund the company’s
business plan, repay the company’s debt and interest obligations,
and maintain its networks; the ability to refinance indebtedness
when required on commercially reasonable terms; changes in the
telecommunications regulatory environment; changes in the
demand for the company’s services and products; the demand
for particular products and services within the overall mix of
products sold, as the company’s products and services have
varying profit margins; the company’s ability to introduce new
service and product offerings on a timely and cost effective basis;
work stoppage caused by labor disputes; restrictions imposed
under various credit facilities and debt instruments; the
company’s ability to attract and retain highly qualified
employees; the company’s ability to access capital markets and
the successful execution of restructuring initiatives; changes in
the funded status of the company’s retiree pension and
healthcare plans; disruption in operations caused by a health
pandemic, such as the H1N1 influenza virus; changes in the
company’s relationships with current large customers, a small
number of whom account for a significant portion of company
revenue; and disruption in the company’s back-office
information technology systems, including its billing system.
More information on potential risks and uncertainties is available
in recent filings with the Securities and Exchange Commission,
including Cincinnati Bell’s Form 10-K report, Form 10-Q
reports and Form 8-K reports. The forward-looking statements
included in this report represent company estimates as of
March 17, 2010. Cincinnati Bell anticipates that subsequent
events and developments will cause its estimates to change.
6