Cincinnati Bell 2009 Annual Report Download - page 53
Download and view the complete annual report
Please find page 53 of the 2009 Cincinnati Bell annual report below. You can navigate through the pages in the report by either clicking on the pages listed below, or by using the keyword search tool below to find specific information within the annual report.-
 1
1 -
2
-
3
-
4
-
5
-
6
-
7
-
8
-
9
-
10
-
11
-
12
-
13
-
14
-
15
-
16
-
17
-
18
-
19
-
20
-
21
-
22
-
23
-
24
-
25
-
26
-
27
-
28
-
29
-
30
-
31
-
32
-
33
-
34
-
35
-
36
-
37
-
38
-
39
-
40
-
41
-
42
-
 43
43 -
 44
44 -
 45
45 -
 46
46 -
 47
47 -
 48
48 -
 49
49 -
 50
50 -
 51
51 -
 52
52 -
 53
53 -
 54
54 -
 55
55 -
 56
56 -
 57
57 -
 58
58 -
 59
59 -
 60
60 -
 61
61 -
 62
62 -
 63
63 -
64
-
65
-
66
-
67
-
68
-
69
-
70
-
71
-
72
-
73
-
74
-
75
-
76
-
77
-
78
-
79
-
80
-
81
-
82
-
83
-
84
-
85
-
86
-
87
-
88
-
89
-
90
-
91
-
92
-
93
-
94
-
95
-
96
-
97
-
98
-
99
-
100
-
101
-
102
-
103
-
104
-
105
-
106
-
107
-
108
-
109
-
110
-
111
-
112
-
113
-
114
-
115
-
116
-
117
-
118
-
119
-
120
-
121
-
122
-
123
-
124
-
125
-
126
-
127
-
128
-
129
-
130
-
131
-
132
-
133
-
134
-
135
-
136
-
137
-
138
-
139
-
140
-
141
-
142
-
143
-
144
-
145
-
146
-
147
-
148
-
149
-
150
-
151
-
152
-
153
-
154
-
155
-
156
-
157
-
158
-
159
-
160
-
161
-
162
-
163
-
164
-
165
-
166
-
167
-
168
-
169
-
170
-
171
-
172
-
173
-
174
-
175
-
176
-
177
-
178
-
179
-
180
-
181
-
182
-
183
-
184
-
185
-
186
-
187
-
188
 |
 |

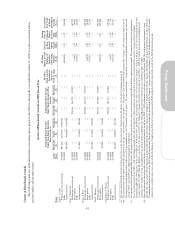
EXECUTIVE COMPENSATION
Summary Compensation Table
The following table sets forth information concerning the compensation of any person who served as the
principal executive officer (John F. Cassidy) or principal financial officer (Gary J. Wojtaszek) during the year
ended December 31, 2009, and the three most highly compensated persons who served as executive officers
(Brian A. Ross, Tara L. Khoury, Christopher J. Wilson) during the year ended December 31, 2009 (collectively,
the “Named Executive Officers”):
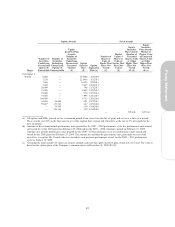
Summary Compensation Table
Name Principal Position Year
Salary
($) Bonus ($)
Stock
Awards
($) (a)
Option
Awards
($) (b)
Non-Equity
Incentive
Plan
Compensation
($) (c)
Change in
Pension Value
and
Non-Qualified
Deferred
Compensation
Earnings
($) (d)
All Other
Compensation
($) (e)
Total
($)
John F. Cassidy ......... 2009 632,596(f) 774,400 — 510,000 1,387,310 1,635,123 46,204 4,985,633
President and Chief
Executive Officer
2008 645,000 1,008,600 1,211,409 388,076 — 1,152,712 49,986 4,455,783
2007 645,000 1,110,160 1,410,486 897,261 — 906,383 41,752 5,011,042
Gary J. Wojtaszek (g) .... 2009 343,269(f) 280,000 367,972 105,526 — 14,256 39,687 1,150,710
Chief Financial Officer 2008 134,615 244,667(h) — 420,931 — 4,413 246,128 1,050,754
Brian A. Ross (g) ........ 2009 416,827(f) 212,500 369,349 83,526 — 153,461 32,200 1,267,863
Chief Operating Officer 2008 398,077 316,800 727,737 206,686 — 82,695 32,000 1,763,995
2007 375,000 511,500 354,750 401,025 — 65,696 31,625 1,739,596
Tara L. Khoury (i) ....... 2009 230,192 151,200 692,500 169,400 — — 7,663 1,250,955
Senior Vice President and
Chief Marketing Officer
Christopher J. Wilson .... 2009 303,057(f) 160,680 279,768 102,107 — 53,623 22,200 921,435
Vice President, General
Counsel and Secretary
2008 309,000 145,539 242,579 120,309 — 22,793 22,000 862,220
2007 300,000 189,600 236,500 160,410 — 25,856 17,761 930,127
(a) The 2009 amounts reflect the grant-date fair value of the performance share based-awards issued in 2009 to Messrs. Wojtaszek, Ross and
Wilson and Ms. Khoury for the 2009 – 2011 performance cycle. The 2008 and 2007 amounts reflect the grant-date fair value of the
performance share based-awards issued in 2008 and 2007 to Messrs. Cassidy, Ross and Wilson for the 2008 – 2010 performance cycle
and the 2007 – 2009 performance cycle, respectively. All amounts assume payout at target. For further discussion of these awards, see
Note 13 to our Consolidated Financial Statements included in our Annual Report on Form 10-K for the year ended December 31, 2009.
The table below shows the amounts if the maximum payout is earned based on the stock price at date of grant.
2009
Stock Awards ($)
2008 2007
John F. Cassidy ................................................. — 1,817,113 2,115,729
Gary J. Wojtaszek ............................................... 551,958 — —
Brian A. Ross .................................................. 554,024 1,091,605 532,125
Tara L. Khoury ................................................. 1,038,750 — —
Christopher J. Wilson ............................................ 419,652 363,868 354,750
(b) The 2009 amounts reflect the grant-date fair value of stock options and SARs granted in January 2009 to Messrs. Cassidy, Wojtaszek, Ross
and Wilson and, in the case of Ms. Khoury, for stock options granted in March 2009 when she joined the Company. The 2008 and 2007
amounts for Messrs. Cassidy, Ross and Wilson reflect the grant-date fair value of stock options granted in December 2008 and 2007,
respectively. The 2008 amounts for Mr. Wojtaszek reflect the grant-date fair value for stock options granted in August 2008 when he
joined the Company and in December 2008. For further discussion of these awards, see Note 13 to our Consolidated Financial Statements
included in our Annual Report on Form 10-K for the year ended December 31, 2009.
39
Proxy Statement