Cincinnati Bell 2009 Annual Report Download - page 58
Download and view the complete annual report
Please find page 58 of the 2009 Cincinnati Bell annual report below. You can navigate through the pages in the report by either clicking on the pages listed below, or by using the keyword search tool below to find specific information within the annual report.-
 1
1 -
2
-
3
-
4
-
5
-
6
-
7
-
8
-
9
-
10
-
11
-
12
-
13
-
14
-
15
-
16
-
17
-
18
-
19
-
20
-
21
-
22
-
23
-
24
-
25
-
26
-
27
-
28
-
29
-
30
-
31
-
32
-
33
-
34
-
35
-
36
-
37
-
38
-
39
-
40
-
41
-
42
-
43
-
44
-
45
-
46
-
47
-
 48
48 -
 49
49 -
 50
50 -
 51
51 -
 52
52 -
 53
53 -
 54
54 -
 55
55 -
 56
56 -
 57
57 -
 58
58 -
 59
59 -
 60
60 -
 61
61 -
 62
62 -
 63
63 -
 64
64 -
 65
65 -
 66
66 -
 67
67 -
 68
68 -
69
-
70
-
71
-
72
-
73
-
74
-
75
-
76
-
77
-
78
-
79
-
80
-
81
-
82
-
83
-
84
-
85
-
86
-
87
-
88
-
89
-
90
-
91
-
92
-
93
-
94
-
95
-
96
-
97
-
98
-
99
-
100
-
101
-
102
-
103
-
104
-
105
-
106
-
107
-
108
-
109
-
110
-
111
-
112
-
113
-
114
-
115
-
116
-
117
-
118
-
119
-
120
-
121
-
122
-
123
-
124
-
125
-
126
-
127
-
128
-
129
-
130
-
131
-
132
-
133
-
134
-
135
-
136
-
137
-
138
-
139
-
140
-
141
-
142
-
143
-
144
-
145
-
146
-
147
-
148
-
149
-
150
-
151
-
152
-
153
-
154
-
155
-
156
-
157
-
158
-
159
-
160
-
161
-
162
-
163
-
164
-
165
-
166
-
167
-
168
-
169
-
170
-
171
-
172
-
173
-
174
-
175
-
176
-
177
-
178
-
179
-
180
-
181
-
182
-
183
-
184
-
185
-
186
-
187
-
188
 |
 |

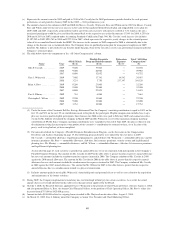
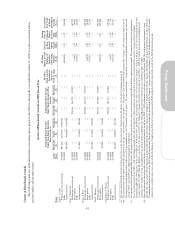
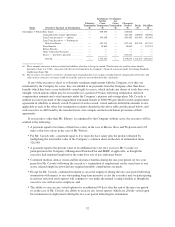
Outstanding Equity Awards at Fiscal Year End
The following table sets forth information concerning options and other equity awards held by the Named
Executive Officers at December 31, 2009:
Outstanding Equity Awards at 2009 Fiscal Year-End
Option Awards Stock Awards
Name
Number of
Securities
Underlying
Unexercised
Option (#)
Exercisable
Number of
Securities
Underlying
Unexercised
Option (#)
Unexercisable
Equity
Incentive Plan
Awards:
Number of
Securities
Underlying
Unexercised
Unearned
Options
(#)
Option
Exercise
Price
($)
Option
Expiration
Date (a)
Number of
Shares or
Units of
Stocks That
Have Not
Vested
(#)
Market
Value of
Shares or
Units of
Stocks That
Have Not
Vested
($)
Equity
Incentive
Plan Awards:
Number of
Unearned
Shares, Units
or Other
Rights That
Have Not
Vested
(#) (b)
Equity
Incentive
Plan Awards:
Market or
Payout Value
of Unearned
Shares, Units
or Other
Rights That
Have Not
Vested
($) (c)
John F.
Cassidy ..... 15,000 — 35.9688 1/3/2010
400,000 — 23.5313 5/23/2010
80,000 — 22.8438 1/2/2011
400,000 — 9.645 12/4/2011
600,000 — 3.48 12/5/2012
801,000 — 5.655 12/4/2013
666,100 — 3.70 12/3/2014
425,000 — 3.995 12/1/2015
85,000 — 3.49 1/27/2016
574,350 — 4.735 12/8/2016
357,988 201,367 4.91 12/7/2017
190,400 489,600 1.67 12/5/2018
— 1,000,000 1.39 1/30/2019
— — 233,527 805,668
Gary J.
Wojtaszek . . . 80,000 120,000 3.75 8/1/2018
90,811 233,513 1.67 12/5/2018
— 76,989 1.39 1/30/2019
— 130,363 1.39 1/30/2019
— — 264,728 913,312
Brian A. Ross . . 25,000 — 35.9688 1/3/2010
20,000 — 22.8438 1/2/2011
5,000 — 16.425 9/5/2011
25,000 — 9.645 12/4/2011
60,000 — 3.48 12/5/2012
61,000 — 5.655 12/4/2013
300,000 — 5.57 1/29/2014
150,000 — 3.70 12/3/2014
150,000 — 3.995 12/1/2015
200,000 — 4.735 12/8/2016
160,000 90,000 4.91 12/7/2017
101,406 260,756 1.67 12/5/2018
— 60,938 1.39 1/30/2019
— 103,185 1.39 1/30/2019
— — 379,972 1,310,903
Tara L.
Khoury ..... 200,000 — 2.21 3/23/2019
— — 250,000 862,500
44