Cincinnati Bell 2009 Annual Report Download - page 171
Download and view the complete annual report
Please find page 171 of the 2009 Cincinnati Bell annual report below. You can navigate through the pages in the report by either clicking on the pages listed below, or by using the keyword search tool below to find specific information within the annual report.-
 1
1 -
2
-
3
-
4
-
5
-
6
-
7
-
8
-
9
-
10
-
11
-
12
-
13
-
14
-
15
-
16
-
17
-
18
-
19
-
20
-
21
-
22
-
23
-
24
-
25
-
26
-
27
-
28
-
29
-
30
-
31
-
32
-
33
-
34
-
35
-
36
-
37
-
38
-
39
-
40
-
41
-
42
-
43
-
44
-
45
-
46
-
47
-
48
-
49
-
50
-
51
-
52
-
53
-
54
-
55
-
56
-
57
-
58
-
59
-
60
-
61
-
62
-
63
-
64
-
65
-
66
-
67
-
68
-
69
-
70
-
71
-
72
-
73
-
74
-
75
-
76
-
77
-
78
-
79
-
80
-
81
-
82
-
83
-
84
-
85
-
86
-
87
-
88
-
89
-
90
-
91
-
92
-
93
-
94
-
95
-
96
-
97
-
98
-
99
-
100
-
101
-
102
-
103
-
104
-
105
-
106
-
107
-
108
-
109
-
110
-
111
-
112
-
113
-
114
-
115
-
116
-
117
-
118
-
119
-
120
-
121
-
122
-
123
-
124
-
125
-
126
-
127
-
128
-
129
-
130
-
131
-
132
-
133
-
134
-
135
-
136
-
137
-
138
-
139
-
140
-
141
-
142
-
143
-
144
-
145
-
146
-
147
-
148
-
149
-
150
-
151
-
152
-
153
-
154
-
155
-
156
-
157
-
158
-
159
-
160
-
 161
161 -
 162
162 -
 163
163 -
 164
164 -
 165
165 -
 166
166 -
 167
167 -
 168
168 -
 169
169 -
 170
170 -
 171
171 -
 172
172 -
 173
173 -
 174
174 -
 175
175 -
 176
176 -
 177
177 -
 178
178 -
 179
179 -
 180
180 -
 181
181 -
182
-
183
-
184
-
185
-
186
-
187
-
188
 |
 |

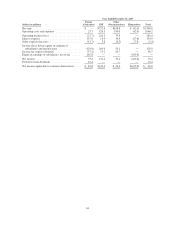
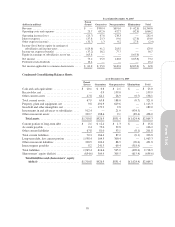
Year Ended December 31, 2008
(dollars in millions)
Parent
(Issuer) Guarantors Non-guarantors Eliminations Total
Cash flows provided by (used in) operating
activities ................................ $(27.8) $ 195.4 $ 236.3 $— $ 403.9
Capital expenditures ......................... (0.6) (132.8) (97.5) — (230.9)
Acquisition of businesses and wireless licenses .... — (17.7) (2.3) — (20.0)
Other investing activities ..................... 0.1 (0.4) 0.7 — 0.4
Cash flows used in investing activities ........... (0.5) (150.9) (99.1) — (250.5)
Funding between Parent and subsidiaries, net ..... 175.6 (39.4) (136.2) — —
Issuance of long-term debt .................... 20.0 — 3.0 — 23.0
Net change in credit and receivables facilities with
initial maturities less than 90 days ............ (2.0) — — — (2.0)
Repayment of debt .......................... (96.6) (5.5) (3.6) — (105.7)
Common stock repurchase .................... (76.8) — — — (76.8)
Other financing activities ..................... (11.0) — (0.3) — (11.3)
Cash flows provided by (used in) financing
activities ................................ 9.2 (44.9) (137.1) — (172.8)
Increase (decrease) in cash and cash
equivalents ............................ (19.1) (0.4) 0.1 — (19.4)
Beginning cash and cash equivalents .......... 23.6 0.8 1.7 — 26.1
Ending cash and cash equivalents ............. $ 4.5 $ 0.4 $ 1.8 $— $ 6.7
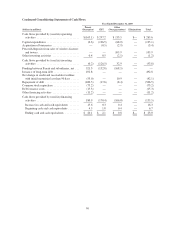
Year Ended December 31, 2007
Parent
(Issuer) Guarantors Non-guarantors Eliminations Total
Cash flows provided by (used in) operating
activities ................................ $ (58.4) $ 224.3 $ 142.9 $— $ 308.8
Capital expenditures ........................ — (143.0) (90.8) — (233.8)
Acquisition of businesses and wireless licenses . . . — (23.4) (4.6) — (28.0)
Other investing activities ..................... (1.2) (1.5) 1.0 — (1.7)
Cash flows used in investing activities .......... (1.2) (167.9) (94.4) — (263.5)
Funding between Parent and subsidiaries, net .... 176.0 (54.9) (121.1) — —
Issuance of long-term debt ................... — 0.6 — — 0.6
Increase in credit and receivables facilities, net . . . 55.0 — 75.0 — 130.0
Repayment of debt .......................... (214.9) (3.3) (0.9) — (219.1)
Other financing activities .................... (8.8) — (1.3) — (10.1)
Cash flows provided by (used in) financing
activities ................................ 7.3 (57.6) (48.3) — (98.6)
Increase (decrease) in cash and cash
equivalents ............................ (52.3) (1.2) 0.2 — (53.3)
Beginning cash and cash equivalents ......... 75.9 2.0 1.5 — 79.4
Ending cash and cash equivalents ............ $ 23.6 $ 0.8 $ 1.7 $— $ 26.1
101
Form 10-K