Cincinnati Bell 2009 Annual Report Download - page 100
Download and view the complete annual report
Please find page 100 of the 2009 Cincinnati Bell annual report below. You can navigate through the pages in the report by either clicking on the pages listed below, or by using the keyword search tool below to find specific information within the annual report.-
 1
1 -
2
-
3
-
4
-
5
-
6
-
7
-
8
-
9
-
10
-
11
-
12
-
13
-
14
-
15
-
16
-
17
-
18
-
19
-
20
-
21
-
22
-
23
-
24
-
25
-
26
-
27
-
28
-
29
-
30
-
31
-
32
-
33
-
34
-
35
-
36
-
37
-
38
-
39
-
40
-
41
-
42
-
43
-
44
-
45
-
46
-
47
-
48
-
49
-
50
-
51
-
52
-
53
-
54
-
55
-
56
-
57
-
58
-
59
-
60
-
61
-
62
-
63
-
64
-
65
-
66
-
67
-
68
-
69
-
70
-
71
-
72
-
73
-
74
-
75
-
76
-
77
-
78
-
79
-
80
-
81
-
82
-
83
-
84
-
85
-
86
-
87
-
88
-
89
-
 90
90 -
 91
91 -
 92
92 -
 93
93 -
 94
94 -
 95
95 -
 96
96 -
 97
97 -
 98
98 -
 99
99 -
 100
100 -
 101
101 -
 102
102 -
 103
103 -
 104
104 -
 105
105 -
 106
106 -
 107
107 -
 108
108 -
 109
109 -
 110
110 -
111
-
112
-
113
-
114
-
115
-
116
-
117
-
118
-
119
-
120
-
121
-
122
-
123
-
124
-
125
-
126
-
127
-
128
-
129
-
130
-
131
-
132
-
133
-
134
-
135
-
136
-
137
-
138
-
139
-
140
-
141
-
142
-
143
-
144
-
145
-
146
-
147
-
148
-
149
-
150
-
151
-
152
-
153
-
154
-
155
-
156
-
157
-
158
-
159
-
160
-
161
-
162
-
163
-
164
-
165
-
166
-
167
-
168
-
169
-
170
-
171
-
172
-
173
-
174
-
175
-
176
-
177
-
178
-
179
-
180
-
181
-
182
-
183
-
184
-
185
-
186
-
187
-
188
 |
 |

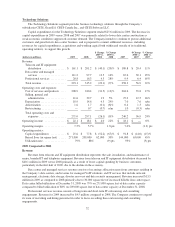
Wireless
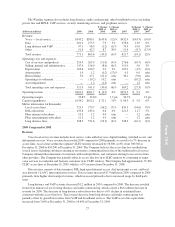
The Wireless segment provides advanced digital voice and data communications services through the
operation of a regional wireless network in the Company’s licensed service territory, which surrounds Cincinnati
and Dayton, Ohio and includes areas of northern Kentucky and southeastern Indiana. Although Wireless does not
market to customers outside of its licensed service territory, it is able to provide service outside of this territory
through roaming agreements with other wireless operators. The segment also sells wireless handset devices and
related accessories to support its service business.
(dollars in millions,
except for operating metrics) 2009 2008
$ Change
2009 vs.
2008
% Change
2009 vs.
2008 2007
$ Change
2008 vs.
2007
% Change
2008 vs.
2007
Revenue:
Service .............................. $284.3 $290.5 $ (6.2) (2)% $267.5 $ 23.0 9%
Equipment ............................ 22.7 25.6 (2.9) (11)% 27.0 (1.4) (5)%
Total revenue ......................... 307.0 316.1 (9.1) (3)% 294.5 21.6 7%
Operating costs and expenses:
Cost of services and products ............. 161.6 162.6 (1.0) (1)% 152.1 10.5 7%
Selling, general and administrative ........ 68.2 70.7 (2.5) (4)% 68.2 2.5 4%
Depreciation .......................... 37.9 33.4 4.5 13% 34.8 (1.4) (4)%
Amortization .......................... 1.5 2.1 (0.6) (29)% 3.0 (0.9) (30)%
Restructuring ......................... — 0.5 (0.5) n/m 2.1 (1.6) n/m
Loss on sale of asset .................... 4.8 — 4.8 n/m — — n/m
Total operating costs and expenses ........ 274.0 269.3 4.7 2% 260.2 9.1 3%
Operating income ........................ $ 33.0 $ 46.8 $(13.8) (29)% $ 34.3 $ 12.5 36%
Operating margin ........................ 10.7% 14.8% (4.1) pts 11.6% 3.2 pts
Capital expenditures ...................... $ 34.9 $ 50.3 $(15.4) (31)% $ 45.7 $ 4.6 10%
Operating metrics
Postpaid ARPU* ....................... $48.56 $48.69 $(0.13) 0% $46.55 $ 2.14 5%
Prepaid ARPU* ....................... $28.64 $26.56 $ 2.08 8% $23.97 $ 2.59 11%
Postpaid subscribers (in thousands) .......... 379.1 403.7 (24.6) (6)% 400.4 3.3 1%
Prepaid subscribers (in thousands) ........... 154.0 146.9 7.1 5% 170.6 (23.7) (14)%
Average postpaid churn ................... 2.2% 2.1% 0.1 pts 1.6% 0.5 pts
* The Company has presented certain information regarding monthly average revenue per user (“ARPU”)
because the Company believes ARPU provides a useful measure of the operational performance of the
wireless business. ARPU is calculated by dividing service revenue by the average subscriber base for the
period.
2009 Compared to 2008
Revenue
Service revenue decreased by $6.2 million during 2009 as compared to last year primarily due to the
following:
•Postpaid service revenue decreased $7.3 million primarily due to a decrease in subscribers. The
Company’s monthly subscriber churn increased from 2.1% in 2008 to 2.2% in 2009. The Company
believes it lost subscribers in 2009 due to the Company’s tightening of credit standards and increased
competition in part driven by handset exclusivity contracts, such as for the iPhoneTM, which keeps the
Company from being able to sell these popular handsets to its customers. ARPU remained steady as a
decline in voice revenue offset a 25% increase in data ARPU, as more customers are using smartphones,
which promotes increased data usage. At December 31, 2009, the Company had 83,000 smartphone
subscribers which represents 22% of its postpaid subscribers, compared to 11% at December 31, 2008;
and
•Prepaid service revenue increased $1.1 million compared to 2008 primarily due to an increase in ARPU of
$2.08, which resulted from the focus on marketing higher value rate plans.
Equipment revenue for 2009 decreased $2.9 million from $25.6 million in 2008 to $22.7 million in 2009
primarily due to lower postpaid subscriber activations partially offset by higher handset revenue per unit.
30