Cincinnati Bell 2008 Annual Report Download - page 66
Download and view the complete annual report
Please find page 66 of the 2008 Cincinnati Bell annual report below. You can navigate through the pages in the report by either clicking on the pages listed below, or by using the keyword search tool below to find specific information within the annual report.-
 1
1 -
2
-
3
-
4
-
5
-
6
-
7
-
8
-
9
-
10
-
11
-
12
-
13
-
14
-
15
-
16
-
17
-
18
-
19
-
20
-
21
-
22
-
23
-
24
-
25
-
26
-
27
-
28
-
29
-
30
-
31
-
32
-
33
-
34
-
35
-
36
-
37
-
38
-
39
-
40
-
41
-
42
-
43
-
44
-
45
-
46
-
47
-
48
-
49
-
50
-
51
-
52
-
53
-
54
-
55
-
 56
56 -
 57
57 -
 58
58 -
 59
59 -
 60
60 -
 61
61 -
 62
62 -
 63
63 -
 64
64 -
 65
65 -
 66
66 -
 67
67 -
 68
68 -
 69
69 -
 70
70 -
 71
71 -
 72
72 -
 73
73 -
 74
74 -
 75
75 -
 76
76 -
77
-
78
-
79
-
80
-
81
-
82
-
83
-
84
-
85
-
86
-
87
-
88
-
89
-
90
-
91
-
92
-
93
-
94
-
95
-
96
-
97
-
98
-
99
-
100
-
101
-
102
-
103
-
104
-
105
-
106
-
107
-
108
-
109
-
110
-
111
-
112
-
113
-
114
-
115
-
116
-
117
-
118
-
119
-
120
-
121
-
122
-
123
-
124
-
125
-
126
-
127
-
128
-
129
-
130
-
131
-
132
-
133
-
134
-
135
-
136
-
137
-
138
-
139
-
140
-
141
-
142
-
143
-
144
-
145
-
146
-
147
-
148
-
149
-
150
-
151
-
152
-
153
-
154
-
155
-
156
-
157
-
158
-
159
-
160
-
161
-
162
-
163
-
164
-
165
-
166
-
167
-
168
-
169
-
170
-
171
-
172
-
173
-
174
-
175
-
176
-
177
-
178
-
179
-
180
-
181
-
182
-
183
-
184
-
185
-
186
-
187
-
188
-
189
-
190
-
191
-
192
-
193
-
194
-
195
-
196
-
197
-
198
-
199
-
200
-
201
-
202
-
203
-
204
-
205
-
206
-
207
-
208
-
209
-
210
-
211
-
212
-
213
-
214
-
215
-
216
-
217
-
218
-
219
-
220
 |
 |

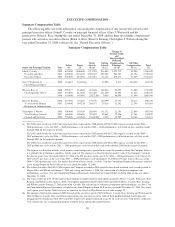
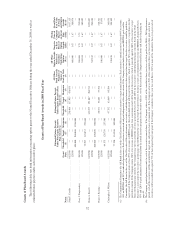
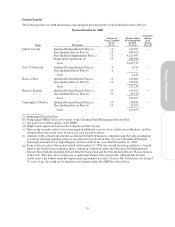
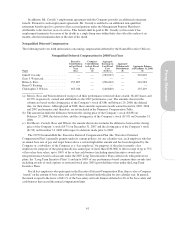
Grants of Plan-Based Awards
The following table sets forth information concerning option grants to the Named Executive Officers during the year ended December 31, 2008 as well as
estimated future payouts under cash incentive plans:
Grants of Plan-Based Awards in 2008 Fiscal Year
Name
Grant
Date
Estimated Future Payouts
Under Non-Equity Incentive
Plan Awards (a)
Estimated Future Payouts
Under Equity Incentive Plan
Awards (b)
All Other
Stock Awards:
Number of
Shares of
Stock or Units
(#)
All Other
Option Awards:
Number of
Securities
Underlying
Options
(#) (c)
Exercise
or Base
Price of
Option
Awards
($/Sh)
Closing
Price of
Company
Shares
on Grant
Date
($/Sh)
Grant Date
Fair Value
of Stock
and Option
Awards
($) (d)
Threshold
($)
Target
($)
Maximum
($)
Threshold
(#)
Target
(#)
Maximum
(#)
John F. Cassidy ........................ 01/25/08 — — — 238,466 317,955 476,933 — — — — 1,817,115
12/5/08 — — — — — — — 680,000 1.67 1.67 388,076
484,000 968,000 1,936,000 — — — — — — — —
Gary J. Wojtaszek(e) ................... 08/1/08 — — — — — — — 200,000 3.75 3.75 235,840
12/5/08 — — — — — — — 324,324 1.67 1.67 185,092
72,917 145,833 291,666 — — — — — — — —
Brian A. Ross(f) ....................... 01/25/08 — — — 143,255 191,007 286,511 — — — — 1,091,607
12/5/08 — — — — — — — 362,162 1.67 1.67 206,686
200,000 400,000 800,000 — — — — — — — —
Brian A. Keating ....................... 01/25/08 — — — 28,651 38,201 57,302 — — — — 218,321
12/5/08 — — — — — — — 100,000 1.67 1.67 57,070
64,375 128,750 257,500 — — — — — — — —
Christopher J. Wilson ................... 01/25/08 — — — 47,752 63,669 95,504 — — — — 363,870
12/5/08 — — — — — — — 210,810 1.67 1.67 120,309
77,250 154,500 309,000 — — — — — — — —
(a) The Compensation Committee (the full Board in the case of the Chief Executive Officer) sets each executive’s target annual incentive. Each executive’s annual incentive is based 40% on revenue,
40% on EBITDA and 20% on individual performance. Each criterion is measured and paid independent of the other criteria. If the Company attains both its revenue and EBITDA goals and the
Committee (the full Board in the case of the Chief Executive Officer) determines an executive’s individual performance meets their expectation for target, then the executive would be paid their
target award. If the Company attains at least 95% of its revenue or EBITDA goal, then a threshold award will be paid to the executive, which is equal to 50% of the executive’s target bonus for that
particular criterion. If the Company attains 120% of its revenue or EBITDA goal, then a maximum award will be paid to the executives which is generally equal to 200% of the executive’s target
bonus for that particular criterion. The Committee may elect to award the executive generally between 0% and 200% for the executive’s individual performance criterion, based on the Chief
Executive’s assessment of the executive’s performance (the full Board in the case of the Chief Executive Officer). Incentive awards are interpolated for revenue and EBITDA attainment between
95% and 120% of goal attainment. For more detail about the annual incentive program for the executive officers, see the discussion in the Compensation Disclosure and Analysis beginning on
page 41.
(b) The Company granted performance units to each of the executives named above. If the Company achieves 100% of the cumulative three-year free cash flow goal for the 2008 — 2010 performance
period, each of the executives will be awarded their target units and paid in shares of common stock. If the Company achieves 90% of the cumulative three-year free cash flow goal, each of the
executives will be awarded units equal to 75% of their original target unit grant. If the Company’s cumulative three-year free cash flow is 110% or more of the cumulative three-year goal, each of
52