Cincinnati Bell 2008 Annual Report Download - page 184
Download and view the complete annual report
Please find page 184 of the 2008 Cincinnati Bell annual report below. You can navigate through the pages in the report by either clicking on the pages listed below, or by using the keyword search tool below to find specific information within the annual report.-
 1
1 -
2
-
3
-
4
-
5
-
6
-
7
-
8
-
9
-
10
-
11
-
12
-
13
-
14
-
15
-
16
-
17
-
18
-
19
-
20
-
21
-
22
-
23
-
24
-
25
-
26
-
27
-
28
-
29
-
30
-
31
-
32
-
33
-
34
-
35
-
36
-
37
-
38
-
39
-
40
-
41
-
42
-
43
-
44
-
45
-
46
-
47
-
48
-
49
-
50
-
51
-
52
-
53
-
54
-
55
-
56
-
57
-
58
-
59
-
60
-
61
-
62
-
63
-
64
-
65
-
66
-
67
-
68
-
69
-
70
-
71
-
72
-
73
-
74
-
75
-
76
-
77
-
78
-
79
-
80
-
81
-
82
-
83
-
84
-
85
-
86
-
87
-
88
-
89
-
90
-
91
-
92
-
93
-
94
-
95
-
96
-
97
-
98
-
99
-
100
-
101
-
102
-
103
-
104
-
105
-
106
-
107
-
108
-
109
-
110
-
111
-
112
-
113
-
114
-
115
-
116
-
117
-
118
-
119
-
120
-
121
-
122
-
123
-
124
-
125
-
126
-
127
-
128
-
129
-
130
-
131
-
132
-
133
-
134
-
135
-
136
-
137
-
138
-
139
-
140
-
141
-
142
-
143
-
144
-
145
-
146
-
147
-
148
-
149
-
150
-
151
-
152
-
153
-
154
-
155
-
156
-
157
-
158
-
159
-
160
-
161
-
162
-
163
-
164
-
165
-
166
-
167
-
168
-
169
-
170
-
171
-
172
-
173
-
 174
174 -
 175
175 -
 176
176 -
 177
177 -
 178
178 -
 179
179 -
 180
180 -
 181
181 -
 182
182 -
 183
183 -
 184
184 -
 185
185 -
 186
186 -
 187
187 -
 188
188 -
 189
189 -
 190
190 -
 191
191 -
 192
192 -
 193
193 -
 194
194 -
195
-
196
-
197
-
198
-
199
-
200
-
201
-
202
-
203
-
204
-
205
-
206
-
207
-
208
-
209
-
210
-
211
-
212
-
213
-
214
-
215
-
216
-
217
-
218
-
219
-
220
 |
 |

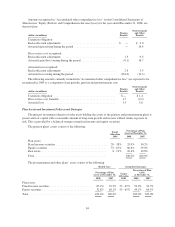
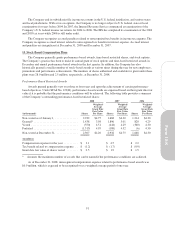
Amounts recognized in “Accumulated other comprehensive loss” on the Consolidated Statements of
Shareowners’ Equity (Deficit) and Comprehensive Income (Loss) for the year ended December 31, 2008, are
shown below:
(dollars in millions)
Pension
Benefits
Postretirement
and Other
Benefits
Transition obligation:
Reclassification adjustments ..................................... $ — $ 2.0
Actuarial gain arising during the period ............................. — 10.4
Prior service cost recognized:
Reclassification adjustments ..................................... 1.3 0.3
Actuarial gain (loss) arising during the period ........................ (0.1) 16.7
Actuarial loss recognized:
Reclassification adjustments ..................................... 2.8 3.5
Actuarial loss arising during the period ............................. (124.0) (10.3)
The following amounts currently included in “Accumulated other comprehensive loss” are expected to be
recognized in 2009 as a component of net periodic pension and postretirement cost:
(dollars in millions)
Pension
Benefits
Postretirement
and Other
Benefits
Transition obligation ........................................... $— $1.4
Prior service cost (benefit) ....................................... 1.7 (0.2)
Actuarial loss ................................................. 5.3 3.8
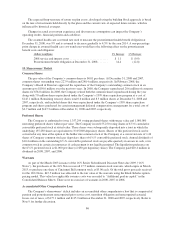
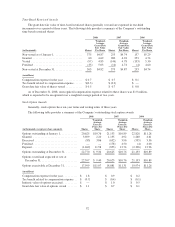
Plan Assets and Investment Policies and Strategies
The primary investment objective for the trusts holding the assets of the pension and postretirement plans is
preservation of capital with a reasonable amount of long-term growth and income without undue exposure to
risk. This is provided by a balanced strategy using fixed income and equity securities.
The pension plans’ assets consist of the following:
Target
Allocation
2009
Percentage of Plan
Assets at December 31,
2008 2007
Plan assets:
Fixed income securities ................................... 20-38% 29.0% 30.2%
Equity securities ........................................ 55-65% 60.6% 59.0%
Real estate ............................................. 8-12% 10.4% 10.8%
Total .................................................. 100.0% 100.0%
The postretirement and other plans’ assets consist of the following:
Health Care Group Life Insurance
Percentage of Plan
Assets at December 31, Target
Allocation
2009
Percentage of Plan
Assets
at December 31,
2008 2007 2008 2007
Plan assets:
Fixed income securities ............................ 67.2% 39.9% 35 - 45% 50.9% 39.5%
Equity securities .................................. 32.8% 60.1% 55 - 65% 49.1% 60.5%
Total ........................................... 100.0% 100.0% 100.0% 100.0%
84