Cincinnati Bell 2008 Annual Report Download - page 192
Download and view the complete annual report
Please find page 192 of the 2008 Cincinnati Bell annual report below. You can navigate through the pages in the report by either clicking on the pages listed below, or by using the keyword search tool below to find specific information within the annual report.-
 1
1 -
2
-
3
-
4
-
5
-
6
-
7
-
8
-
9
-
10
-
11
-
12
-
13
-
14
-
15
-
16
-
17
-
18
-
19
-
20
-
21
-
22
-
23
-
24
-
25
-
26
-
27
-
28
-
29
-
30
-
31
-
32
-
33
-
34
-
35
-
36
-
37
-
38
-
39
-
40
-
41
-
42
-
43
-
44
-
45
-
46
-
47
-
48
-
49
-
50
-
51
-
52
-
53
-
54
-
55
-
56
-
57
-
58
-
59
-
60
-
61
-
62
-
63
-
64
-
65
-
66
-
67
-
68
-
69
-
70
-
71
-
72
-
73
-
74
-
75
-
76
-
77
-
78
-
79
-
80
-
81
-
82
-
83
-
84
-
85
-
86
-
87
-
88
-
89
-
90
-
91
-
92
-
93
-
94
-
95
-
96
-
97
-
98
-
99
-
100
-
101
-
102
-
103
-
104
-
105
-
106
-
107
-
108
-
109
-
110
-
111
-
112
-
113
-
114
-
115
-
116
-
117
-
118
-
119
-
120
-
121
-
122
-
123
-
124
-
125
-
126
-
127
-
128
-
129
-
130
-
131
-
132
-
133
-
134
-
135
-
136
-
137
-
138
-
139
-
140
-
141
-
142
-
143
-
144
-
145
-
146
-
147
-
148
-
149
-
150
-
151
-
152
-
153
-
154
-
155
-
156
-
157
-
158
-
159
-
160
-
161
-
162
-
163
-
164
-
165
-
166
-
167
-
168
-
169
-
170
-
171
-
172
-
173
-
174
-
175
-
176
-
177
-
178
-
179
-
180
-
181
-
 182
182 -
 183
183 -
 184
184 -
 185
185 -
 186
186 -
 187
187 -
 188
188 -
 189
189 -
 190
190 -
 191
191 -
 192
192 -
 193
193 -
 194
194 -
 195
195 -
 196
196 -
 197
197 -
 198
198 -
 199
199 -
 200
200 -
 201
201 -
 202
202 -
203
-
204
-
205
-
206
-
207
-
208
-
209
-
210
-
211
-
212
-
213
-
214
-
215
-
216
-
217
-
218
-
219
-
220
 |
 |

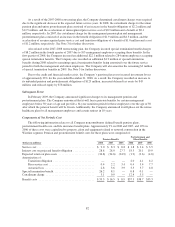
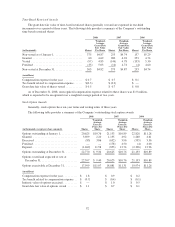
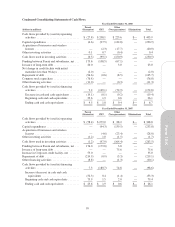
Time-Based Restricted Awards
The grant date fair value of time-based restricted shares generally vest and are expensed in one-third
increments over a period of three years. The following table provides a summary of the Company’s outstanding
time-based restricted shares:
2008 2007 2006
(in thousands) Shares
Weighted-
Average
Grant Date
Fair Value
Per Share Shares
Weighted-
Average
Grant Date
Fair Value
Per Share Shares
Weighted-
Average
Grant Date
Fair Value
Per Share
Non-vested as of January 1, ................... 375 $4.87 253 $4.74 157 $5.29
Granted ................................... 60 4.69 280 4.94 253 4.74
Vested .................................... (97) 4.85 (144) 4.78 (153) 5.30
Forfeited .................................. (35) 5.03 (14) 4.74 (4) 4.60
Non-vested at December 31, ................... 303 $4.82 375 $4.87 253 $4.74
(in millions)
Compensation expense for the year ............. $0.7 $ 0.7 $ 0.1
Tax benefit related to compensation expense ...... $(0.3) $ (0.3) $ —
Grant date fair value of shares vested ............ $0.5 $ 0.7 $ 0.8
As of December 31, 2008, unrecognized compensation expense related to these shares was $1.0 million,
which is expected to be recognized over a weighted average period of two years.
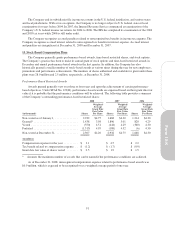
Stock Option Awards
Generally, stock options have ten-year terms and vesting terms of three years.
The following table provides a summary of the Company’s outstanding stock option awards:
2008 2007 2006
(in thousands, except per share amounts) Shares
Weighted-
Average
Exercise
Prices Per
Share Shares
Weighted-
Average
Exercise
Prices Per
Share Shares
Weighted-
Average
Exercise
Prices Per
Share
Options outstanding at January 1, ........... 20,625 $10.76 21,153 $10.89 22,828 $11.28
Granted ............................... 3,699 2.20 1,135 4.92 1,260 4.61
Exercised .............................. (85) 3.86 (632) 3.96 (535) 3.56
Forfeited ............................... — — (178) 4.50 (4) 4.00
Expired ................................ (1,469) 11.58 (853) 12.74 (2,396) 12.96
Options outstanding at December 31, ........ 22,770 $ 9.34 20,625 $10.76 21,153 $10.89
Options vested and expected to vest at
December 31, ......................... 22,597 $ 9.40 20,625 $10.76 21,153 $10.89
Options exercisable at December 31, ........ 17,999 $11.07 18,881 $11.31 19,974 $11.26
(in millions)
Compensation expense for the year .......... $ 1.8 $ 0.9 $ 0.2
Tax benefit related to compensation expense . . $ (0.7) $ (0.4) $ (0.1)
Intrinsic value of options exercised .......... $ — $ 1.0 $ 0.5
Grant date fair value of options vested ....... $ 1.1 $ 0.7 $ 0.1
92