Cincinnati Bell 2008 Annual Report Download - page 58
Download and view the complete annual report
Please find page 58 of the 2008 Cincinnati Bell annual report below. You can navigate through the pages in the report by either clicking on the pages listed below, or by using the keyword search tool below to find specific information within the annual report.-
 1
1 -
2
-
3
-
4
-
5
-
6
-
7
-
8
-
9
-
10
-
11
-
12
-
13
-
14
-
15
-
16
-
17
-
18
-
19
-
20
-
21
-
22
-
23
-
24
-
25
-
26
-
27
-
28
-
29
-
30
-
31
-
32
-
33
-
34
-
35
-
36
-
37
-
38
-
39
-
40
-
41
-
42
-
43
-
44
-
45
-
46
-
47
-
 48
48 -
 49
49 -
 50
50 -
 51
51 -
 52
52 -
 53
53 -
 54
54 -
 55
55 -
 56
56 -
 57
57 -
 58
58 -
 59
59 -
 60
60 -
 61
61 -
 62
62 -
 63
63 -
 64
64 -
 65
65 -
 66
66 -
 67
67 -
 68
68 -
69
-
70
-
71
-
72
-
73
-
74
-
75
-
76
-
77
-
78
-
79
-
80
-
81
-
82
-
83
-
84
-
85
-
86
-
87
-
88
-
89
-
90
-
91
-
92
-
93
-
94
-
95
-
96
-
97
-
98
-
99
-
100
-
101
-
102
-
103
-
104
-
105
-
106
-
107
-
108
-
109
-
110
-
111
-
112
-
113
-
114
-
115
-
116
-
117
-
118
-
119
-
120
-
121
-
122
-
123
-
124
-
125
-
126
-
127
-
128
-
129
-
130
-
131
-
132
-
133
-
134
-
135
-
136
-
137
-
138
-
139
-
140
-
141
-
142
-
143
-
144
-
145
-
146
-
147
-
148
-
149
-
150
-
151
-
152
-
153
-
154
-
155
-
156
-
157
-
158
-
159
-
160
-
161
-
162
-
163
-
164
-
165
-
166
-
167
-
168
-
169
-
170
-
171
-
172
-
173
-
174
-
175
-
176
-
177
-
178
-
179
-
180
-
181
-
182
-
183
-
184
-
185
-
186
-
187
-
188
-
189
-
190
-
191
-
192
-
193
-
194
-
195
-
196
-
197
-
198
-
199
-
200
-
201
-
202
-
203
-
204
-
205
-
206
-
207
-
208
-
209
-
210
-
211
-
212
-
213
-
214
-
215
-
216
-
217
-
218
-
219
-
220
 |
 |
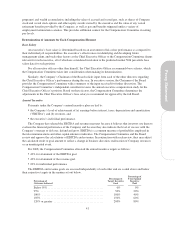
Stock Options
The Company grants stock options with an exercise price equal to the fair market value of the Company’s
common shares on the date of grant. The “fair market value” of the Company’s common shares on the date of
grant is generally defined in the 2007 Long Term Incentive Plan as the closing price of the stock on the NYSE on
the date of grant. To encourage executives to achieve the Company’s long-term goals, stock options generally
vest over a three-year period with a percentage of the award vesting each year. Stock options cannot remain
outstanding beyond a ten-year period. The Compensation Committee has a long-standing practice of making its
annual grants of stock options at its December meeting.
The Compensation Committee (and in the case of the Chief Executive Officer, the full Board) grants stock
option awards based upon a review of peer company practices and each executive’s performance (as well as the
Chief Executive Officer’s recommendations concerning the other executives). Because of the small in-the-money
value of prior years’ stock option grants, the Compensation Committee has not considered prior years’ grants in
determining amounts of stock options granted. Thus, the actual option award to a named executive officer is a
function of market data from the peer groups, the dollar value in long-term incentive approved by the
Compensation Committee, the binomial value of one stock option on the actual date of grant, and the executive’s
individual performance.
As noted in the preceding section, for this half of the executive officers’ 2009 long-term equity grants, a
combination of stock options and SARs were used.
Performance Plan
Performance-based awards, which are paid in common shares, are based on the achievement of specific
Company quantitative goals over a three-year performance period. Such awards are granted during the first
quarter of each calendar year following finalization and approval by the full Board of the one-year, two-year
cumulative and three-year cumulative financial goal(s) for the next three-year period. For the 2006 – 2008
performance period and subsequent three-year performance periods (for which the performance-based awards
have consisted of and will consist of performance units), the Compensation Committee (and the full Board in the
case of the Chief Executive Officer) established a criterion of adjusted free cash flow. To compute each
executive’s performance plan attainment, the Company adds to or subtracts from reported free cash flow certain
pre-established and non-recurring investment and financing cash flows. Additionally, the Compensation
Committee or the Board may also adjust reported free cash flow for unanticipated items, reallocation of
Company resources or changes in certain business objectives. The Compensation Committee and the full Board
have selected adjusted free cash flow as the performance measure for performance-based awards because both
believe that the Company’s ability to generate strong cash flow over a sustained period is the key to continuing
its de-lever, defend and grow strategy over the next several years.
Using peer group data (along with the Chief Executive Officer’s recommendations for the other executives),
the Compensation Committee makes performance unit grants to each executive other than the Chief Executive
Officer and makes a recommendation to the full Board for performance unit grants for the Chief Executive
Officer. The actual number of performance units granted is based on the long-term incentive dollar value
approved by the Compensation Committee and the value of one share of stock on the date of grant. The threshold
and target performance levels are the same for each of the named executive officers. For each performance cycle,
actual adjusted free cash flow achieved must be at least 90% of the target goal in order to generate a threshold
level payout equal to 75% of the target award for each executive.
As previously discussed, due to the depletion of available shares and the 1,000,000 share annual individual
limit, it was determined to make the Chief Executive Officer’s target award, if achieved, payable in cash under
the 2009 – 2011 performance plan cycle.
For the 2006 – 2008 cumulative period under the 2006 – 2008 performance cycle, the adjusted free cash
flow target goal and result were, respectively, $499.0 million and $577.7 million, or 115.8% of the target goal.
For the 2007 – 2008 cumulative period under the 2007 – 2009 performance cycle, the adjusted free cash flow
target goal and result were, respectively, $256.0 million and $337.1 million, or 131.7% of the target goal. For the
44