Cincinnati Bell 2008 Annual Report Download - page 130
Download and view the complete annual report
Please find page 130 of the 2008 Cincinnati Bell annual report below. You can navigate through the pages in the report by either clicking on the pages listed below, or by using the keyword search tool below to find specific information within the annual report.-
 1
1 -
2
-
3
-
4
-
5
-
6
-
7
-
8
-
9
-
10
-
11
-
12
-
13
-
14
-
15
-
16
-
17
-
18
-
19
-
20
-
21
-
22
-
23
-
24
-
25
-
26
-
27
-
28
-
29
-
30
-
31
-
32
-
33
-
34
-
35
-
36
-
37
-
38
-
39
-
40
-
41
-
42
-
43
-
44
-
45
-
46
-
47
-
48
-
49
-
50
-
51
-
52
-
53
-
54
-
55
-
56
-
57
-
58
-
59
-
60
-
61
-
62
-
63
-
64
-
65
-
66
-
67
-
68
-
69
-
70
-
71
-
72
-
73
-
74
-
75
-
76
-
77
-
78
-
79
-
80
-
81
-
82
-
83
-
84
-
85
-
86
-
87
-
88
-
89
-
90
-
91
-
92
-
93
-
94
-
95
-
96
-
97
-
98
-
99
-
100
-
101
-
102
-
103
-
104
-
105
-
106
-
107
-
108
-
109
-
110
-
111
-
112
-
113
-
114
-
115
-
116
-
117
-
118
-
119
-
 120
120 -
 121
121 -
 122
122 -
 123
123 -
 124
124 -
 125
125 -
 126
126 -
 127
127 -
 128
128 -
 129
129 -
 130
130 -
 131
131 -
 132
132 -
 133
133 -
 134
134 -
 135
135 -
 136
136 -
 137
137 -
 138
138 -
 139
139 -
 140
140 -
141
-
142
-
143
-
144
-
145
-
146
-
147
-
148
-
149
-
150
-
151
-
152
-
153
-
154
-
155
-
156
-
157
-
158
-
159
-
160
-
161
-
162
-
163
-
164
-
165
-
166
-
167
-
168
-
169
-
170
-
171
-
172
-
173
-
174
-
175
-
176
-
177
-
178
-
179
-
180
-
181
-
182
-
183
-
184
-
185
-
186
-
187
-
188
-
189
-
190
-
191
-
192
-
193
-
194
-
195
-
196
-
197
-
198
-
199
-
200
-
201
-
202
-
203
-
204
-
205
-
206
-
207
-
208
-
209
-
210
-
211
-
212
-
213
-
214
-
215
-
216
-
217
-
218
-
219
-
220
 |
 |

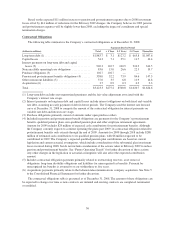
Depreciation expense increased $5.8 million for 2007 versus 2006. The increase was primarily due to the
shortening of the useful lives of certain GSM assets as a result of the Company constructing its 3G network
overlay, which the Company completed in 2008.
Decreased amortization expense resulted from the accelerated amortization methodology used, which causes
a decrease in amortization in each subsequent year.
Restructuring expenses for 2007 were primarily due to the restructuring plan announced in the fourth quarter
of 2007 to reduce costs and increase operational efficiencies. See Note 3 to the Consolidated Financial
Statements for further discussion.
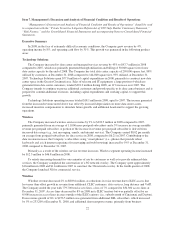
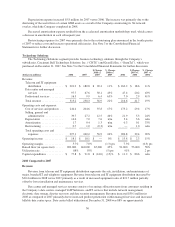
Technology Solutions
The Technology Solutions segment provides business technology solutions through the Company’s
subsidiaries, Cincinnati Bell Technology Solutions, Inc. (“CBTS”) and GramTel Inc. (“GramTel”), which was
purchased on December 31, 2007. See Note 5 to the Consolidated Financial Statements for further discussion.
(dollars in millions) 2008 2007
$ Change
2008 vs.
2007
% Change
2008 vs.
2007 2006
$ Change
2007 vs.
2006
% Change
2007 vs.
2006
Revenue:
Telecom and IT equipment
distribution .............. $ 201.2 $ 180.8 $ 20.4 11% $ 162.2 $ 18.6 11%
Data center and managed
services ................. 97.7 67.6 30.1 45% 47.4 20.2 43%
Professional services ......... 16.3 9.9 6.4 65% 7.0 2.9 41%
Total revenue ............... 315.2 258.3 56.9 22% 216.6 41.7 19%
Operating costs and expenses:
Cost of services and products . . 240.4 204.6 35.8 17% 175.2 29.4 17%
Selling, general and
administrative ............ 39.7 27.2 12.5 46% 21.9 5.3 24%
Depreciation ............... 14.6 7.0 7.6 n/m 3.4 3.6 n/m
Amortization ............... 1.7 0.4 1.3 n/m 0.3 0.1 33%
Restructuring ............... 0.7 1.0 (0.3) n/m — 1.0 n/m
Total operating costs and
expenses ................ 297.1 240.2 56.9 24% 200.8 39.4 20%
Operating income ............. $ 18.1 $ 18.1 $ — 0% $ 15.8 $ 2.3 15%
Operating margin .............. 5.7% 7.0% (1.3) pts 7.3% (0.3) pts
Raised floor (in square feet) ..... 209,000 144,000 65,000 45% 91,000 53,000 58%
Utilization rate ................ 88% 93% (5)pts 91% 2pts
Capital expenditures ........... $ 77.8 $ 91.8 $ (14.0) (15)% $ 11.2 $ 80.6 n/m
2008 Compared to 2007
Revenue
Revenue from telecom and IT equipment distribution represents the sale, installation, and maintenance of
major, branded IT and telephony equipment. Revenue from telecom and IT equipment distribution increased by
$20.4 million in 2008 versus 2007 primarily as a result of increased equipment sales of $21.7 million partially
offset by lower installation and maintenance services.
Data center and managed services revenue consists of recurring collocation rents from customers residing in
the Company’s data centers, managed VoIP Solutions, and IT services that include network management,
electronic data storage, disaster recovery and data security management. Revenue increased $30.1 million in
2008 as compared to 2007 primarily due to increased product penetration within managed services and increased
billable data center space. Data center billed utilization at December 31, 2008 was 88% on approximately
30