Cincinnati Bell 2008 Annual Report Download - page 186
Download and view the complete annual report
Please find page 186 of the 2008 Cincinnati Bell annual report below. You can navigate through the pages in the report by either clicking on the pages listed below, or by using the keyword search tool below to find specific information within the annual report.-
 1
1 -
2
-
3
-
4
-
5
-
6
-
7
-
8
-
9
-
10
-
11
-
12
-
13
-
14
-
15
-
16
-
17
-
18
-
19
-
20
-
21
-
22
-
23
-
24
-
25
-
26
-
27
-
28
-
29
-
30
-
31
-
32
-
33
-
34
-
35
-
36
-
37
-
38
-
39
-
40
-
41
-
42
-
43
-
44
-
45
-
46
-
47
-
48
-
49
-
50
-
51
-
52
-
53
-
54
-
55
-
56
-
57
-
58
-
59
-
60
-
61
-
62
-
63
-
64
-
65
-
66
-
67
-
68
-
69
-
70
-
71
-
72
-
73
-
74
-
75
-
76
-
77
-
78
-
79
-
80
-
81
-
82
-
83
-
84
-
85
-
86
-
87
-
88
-
89
-
90
-
91
-
92
-
93
-
94
-
95
-
96
-
97
-
98
-
99
-
100
-
101
-
102
-
103
-
104
-
105
-
106
-
107
-
108
-
109
-
110
-
111
-
112
-
113
-
114
-
115
-
116
-
117
-
118
-
119
-
120
-
121
-
122
-
123
-
124
-
125
-
126
-
127
-
128
-
129
-
130
-
131
-
132
-
133
-
134
-
135
-
136
-
137
-
138
-
139
-
140
-
141
-
142
-
143
-
144
-
145
-
146
-
147
-
148
-
149
-
150
-
151
-
152
-
153
-
154
-
155
-
156
-
157
-
158
-
159
-
160
-
161
-
162
-
163
-
164
-
165
-
166
-
167
-
168
-
169
-
170
-
171
-
172
-
173
-
174
-
175
-
 176
176 -
 177
177 -
 178
178 -
 179
179 -
 180
180 -
 181
181 -
 182
182 -
 183
183 -
 184
184 -
 185
185 -
 186
186 -
 187
187 -
 188
188 -
 189
189 -
 190
190 -
 191
191 -
 192
192 -
 193
193 -
 194
194 -
 195
195 -
 196
196 -
197
-
198
-
199
-
200
-
201
-
202
-
203
-
204
-
205
-
206
-
207
-
208
-
209
-
210
-
211
-
212
-
213
-
214
-
215
-
216
-
217
-
218
-
219
-
220
 |
 |

The expected long-term rate of return on plan assets, developed using the building block approach, is based
on the mix of investments held directly by the plans and the current view of expected future returns, which is
influenced by historical averages.
Changes in actual asset return experience and discount rate assumptions can impact the Company’s
operating results, financial position and cash flows.
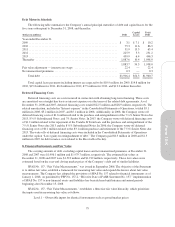
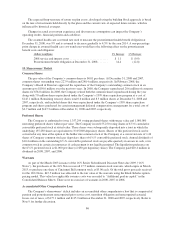
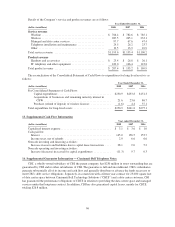
The assumed health care cost trend rate used to measure the postretirement health benefit obligation at
December 31, 2008, was 9% and is assumed to decrease gradually to 4.5% by the year 2014. A one-percentage
point change in assumed health care cost trend rates would have the following effect on the postretirement
benefit costs and obligation:
(dollars in millions) 1% Increase 1% Decrease
2008 service and interest costs ........................... $ 1.1 $ (0.9)
Postretirement benefit obligation at December 31, 2008 ....... 14.4 (12.8)
10. Shareowners’ Deficit
Common Shares
The par value of the Company’s common shares is $0.01 per share. At December 31, 2008 and 2007,
common shares outstanding were 227.9 million and 248.4 million, respectively. In February 2008, the
Company’s Board of Directors approved the repurchase of the Company’s outstanding common stock in an
amount up to $150.0 million over the next two years. In 2008, the Company repurchased 20.6 million of common
shares for $76.8 million. In 2008, the Company retired both the common shares repurchased during the year
along with 7.8 million shares repurchased under the Company’s 1999 share repurchase program at a cost of
$145.1 million. Remaining treasury shares total 0.6 million and 8.3 million shares at December 31, 2008 and
2007, respectively, and included shares that were repurchased under the Company’s 1999 share repurchase
program and shares purchased for certain management deferred compensation arrangements for a total cost of
$2.7 million and $147.3 million at December 31, 2008 and 2007, respectively.
Preferred Shares
The Company is authorized to issue 1,357,299 voting preferred shares without par value and 1,000,000
nonvoting preferred shares without par value. The Company issued 155,250 voting shares of 6
3
⁄
4
% cumulative
convertible preferred stock at stated value. These shares were subsequently deposited into a trust in which the
underlying 155,250 shares are equivalent to 3,105,000 depositary shares. Shares of this preferred stock can be
converted at any time at the option of the holder into common stock of the Company at a conversion rate of 1.44
shares of Company common stock per depositary share of 6
3
⁄
4
% convertible preferred stock. Annual dividends of
$10.4 million on the outstanding 6
3
⁄
4
% convertible preferred stock are payable quarterly in arrears in cash, or in
common stock in certain circumstances if cash payment is not legally permitted. The liquidation preference on
the 6
3
⁄
4
% preferred stock is $1,000 per share (or $50 per depositary share). The Company paid $10.4 million in
dividends in 2008, 2007, and 2006.
Warrants
As part of the March 2003 issuance of the 16% Senior Subordinated Discount Notes due 2009 (“16%
Notes”), the purchasers of the 16% Notes received 17.5 million common stock warrants, which expire in March
2013, to purchase one share of Cincinnati Bell common stock at $3.00 each. Of the total gross proceeds received
for the 16% Notes, $47.5 million was allocated to the fair value of the warrants using the Black-Scholes option-
pricing model. This value less applicable issuance costs was recorded to “Additional paid-in capital” in the
Consolidated Balance Sheets. There were no exercises of warrants in 2008, 2007 or 2006.
Accumulated Other Comprehensive Loss
The Company’s shareowners’ deficit includes an accumulated other comprehensive loss that is comprised of
pension and postretirement unrecognized prior service cost, transition obligation and unrecognized actuarial
losses, net of taxes, of $177.1 million and $115.9 million at December 31, 2008 and 2007, respectively. Refer to
Note 9 for further discussion.
86