Cincinnati Bell 2004 Annual Report Download - page 51
Download and view the complete annual report
Please find page 51 of the 2004 Cincinnati Bell annual report below. You can navigate through the pages in the report by either clicking on the pages listed below, or by using the keyword search tool below to find specific information within the annual report.-
 1
1 -
2
-
3
-
4
-
5
-
6
-
7
-
8
-
9
-
10
-
11
-
12
-
13
-
14
-
15
-
16
-
17
-
18
-
19
-
20
-
21
-
22
-
23
-
24
-
25
-
26
-
27
-
28
-
29
-
30
-
31
-
32
-
33
-
34
-
35
-
36
-
37
-
38
-
39
-
40
-
 41
41 -
 42
42 -
 43
43 -
 44
44 -
 45
45 -
 46
46 -
 47
47 -
 48
48 -
 49
49 -
 50
50 -
 51
51 -
 52
52 -
 53
53 -
 54
54 -
 55
55 -
 56
56 -
 57
57 -
 58
58 -
 59
59 -
 60
60 -
 61
61 -
62
-
63
-
64
-
65
-
66
-
67
-
68
-
69
-
70
-
71
-
72
-
73
-
74
-
75
-
76
-
77
-
78
-
79
-
80
-
81
-
82
-
83
-
84
-
85
-
86
-
87
-
88
-
89
-
90
-
91
-
92
-
93
-
94
-
95
-
96
-
97
-
98
-
99
-
100
-
101
-
102
-
103
-
104
-
105
-
106
-
107
-
108
-
109
-
110
-
111
-
112
-
113
-
114
-
115
-
116
-
117
-
118
-
119
-
120
-
121
-
122
-
123
-
124
-
125
-
126
-
127
-
128
-
129
-
130
-
131
-
132
-
133
-
134
-
135
-
136
-
137
-
138
-
139
-
140
-
141
-
142
-
143
-
144
-
145
-
146
-
147
-
148
-
149
-
150
-
151
-
152
-
153
-
154
-
155
-
156
-
157
-
158
-
159
-
160
-
161
-
162
-
163
-
164
-
165
-
166
-
167
-
168
-
169
-
170
-
171
-
172
-
173
-
174
-
175
-
176
-
177
-
178
-
179
-
180
-
181
-
182
-
183
-
184
-
185
-
186
-
187
-
188
-
189
-
190
-
191
-
192
-
193
-
194
-
195
-
196
-
197
-
198
-
199
-
200
 |
 |

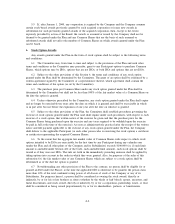
STOCK PERFORMANCE GRAPH
The graph below shows the cumulative total shareholder return assuming the investment of $100 on
December 31, 1999 (and the reinvestment of dividends thereafter) in each of (i) the Company’s common shares
(ii) the S&P 500tStock Index, (iii) the Network Telecom Peer Group, and (iv) the New Custom Composite
Index. With the Company’s transformation from a national carrier of data and Internet traffic to a local exchange
company, the New Custom Composite Index should provide a more meaningful comparison between the
Company’s performance and that of its peers than the Network Telecom Peer Group used previously.
Dec-99 Dec-00 Dec-01 Dec-02 Dec-03 Dec-04
Cincinnati Bell Inc. ........................... $100 $62 $26 $10 $14 $11
S&P 500t.................................... $100 $91 $80 $62 $80 $89
Network Telecom Peer Group ................ $100 $80 $63 $47 $47 $54
New Custom Composite Index (7 Stocks) .... $100 $90 $83 $64 $64 $72
Copyright © 2005, Standards & Poor’s, a division of The McGraw-Hill Companies, Inc. All rights reserved.
CUMULATIVE TOTAL RETURN
Based upon an initial investment of $100 on December 31, 1999
with dividends reinvested
$0
$50
$100
$150
$200
$250
De c- 99 De c- 00 De c- 01 De c- 02 De c- 03 De c- 04
SOURCE: GEORGESON SHAREHOLDER COMMUNICATIONS INC.
Cincinnati Bell Inc. S&P 500®
Network Telecom Peer Group New Custom Composite Index (7 Stocks)
39
Proxy Statement