Cincinnati Bell 2004 Annual Report Download - page 174
Download and view the complete annual report
Please find page 174 of the 2004 Cincinnati Bell annual report below. You can navigate through the pages in the report by either clicking on the pages listed below, or by using the keyword search tool below to find specific information within the annual report.-
 1
1 -
2
-
3
-
4
-
5
-
6
-
7
-
8
-
9
-
10
-
11
-
12
-
13
-
14
-
15
-
16
-
17
-
18
-
19
-
20
-
21
-
22
-
23
-
24
-
25
-
26
-
27
-
28
-
29
-
30
-
31
-
32
-
33
-
34
-
35
-
36
-
37
-
38
-
39
-
40
-
41
-
42
-
43
-
44
-
45
-
46
-
47
-
48
-
49
-
50
-
51
-
52
-
53
-
54
-
55
-
56
-
57
-
58
-
59
-
60
-
61
-
62
-
63
-
64
-
65
-
66
-
67
-
68
-
69
-
70
-
71
-
72
-
73
-
74
-
75
-
76
-
77
-
78
-
79
-
80
-
81
-
82
-
83
-
84
-
85
-
86
-
87
-
88
-
89
-
90
-
91
-
92
-
93
-
94
-
95
-
96
-
97
-
98
-
99
-
100
-
101
-
102
-
103
-
104
-
105
-
106
-
107
-
108
-
109
-
110
-
111
-
112
-
113
-
114
-
115
-
116
-
117
-
118
-
119
-
120
-
121
-
122
-
123
-
124
-
125
-
126
-
127
-
128
-
129
-
130
-
131
-
132
-
133
-
134
-
135
-
136
-
137
-
138
-
139
-
140
-
141
-
142
-
143
-
144
-
145
-
146
-
147
-
148
-
149
-
150
-
151
-
152
-
153
-
154
-
155
-
156
-
157
-
158
-
159
-
160
-
161
-
162
-
163
-
 164
164 -
 165
165 -
 166
166 -
 167
167 -
 168
168 -
 169
169 -
 170
170 -
 171
171 -
 172
172 -
 173
173 -
 174
174 -
 175
175 -
 176
176 -
 177
177 -
 178
178 -
 179
179 -
 180
180 -
 181
181 -
 182
182 -
 183
183 -
 184
184 -
185
-
186
-
187
-
188
-
189
-
190
-
191
-
192
-
193
-
194
-
195
-
196
-
197
-
198
-
199
-
200
 |
 |
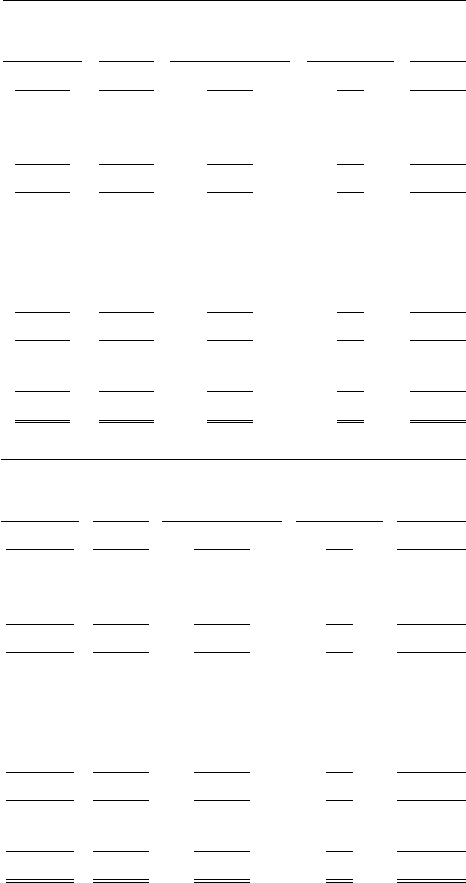
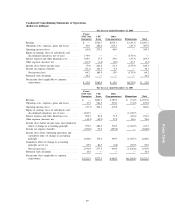
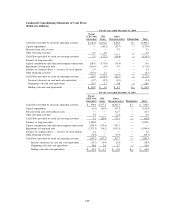
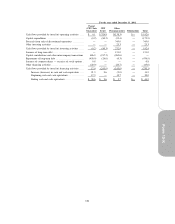
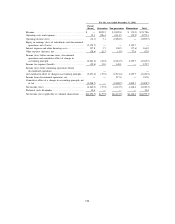
Condensed Consolidating Statements of Cash Flows
(dollars in millions)
For the year ended December 31, 2004
Parent
(CBT Note
Guarantor)
CBT
Issuer
Other
(Non-guarantors) Eliminations Total
Cash flows provided by (used in) operating activities .... $ (33.5) $ 251.2 $ 83.0 $— $ 300.7
Capital expenditures .................................. — (80.2) (53.7) — (133.9)
Proceeds from sale of assets ........................... — — 3.3 — 3.3
Other investing activities .............................. 3.3 3.0 — 6.3
Cash Flows provided by (used in) investing activities .... 3.3 (77.2) (50.4) — (124.3)
Issuance of long-term debt ............................. — — — — —
Capital contributions and other intercompany transactions 206.8 (173.4) (33.4) — 0.0
Repayment of long-term debt .......................... (169.5) (3.0) 0.7 — (171.8)
Issuance of common shares — exercise of stock options . 2.4 — — — 2.4
Other financing activities .............................. (10.2) 2.1 — — (8.1)
Cash Flows provided by (used in) financing activities .... 29.5 (174.3) (32.7) — (177.5)
Increase (decrease) in cash and cash equivalents ...... (0.7) (0.3) (0.1) — (1.1)
Beginning cash and cash equivalents ................. 23.5 1.7 0.8 — 26.0
Ending cash and cash equivalents .................... $ 22.8 $ 1.4 $ 0.7 $— $ 24.9
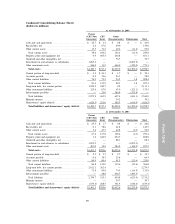
For the year ended December 31, 2003
Parent
(CBT Note
Guarantor)
CBT
Issuer
Other
(Non-guarantors) Eliminations Total
Cash flows provided by (used in) operating activities .... $ 339.0 $ 277.3 $(305.7) $— $ 310.6
Capital expenditures .................................. (0.1) (81.0) (45.3) — (126.4)
Proceeds from sale of broadband assets ................. — — 82.7 — 82.7
Other investing activities .............................. 3.2 — (2.3) — 0.9
Cash Flows provided by (used in) investing activities .... 3.1 (81.0) 35.1 — (42.8)
Issuance of long-term debt ............................. 1,390.0 — — — 1,390.0
Capital contributions and other intercompany transactions (299.3) (173.0) 472.3 — —
Repayment of long-term debt .......................... (1,371.3) (24.2) (195.1) — (1,590.6)
Issuance of common shares — exercise of stock options . 2.2 — — — 2.2
Other financing activities .............................. (78.8) — (9.5) — (88.3)
Cash Flows provided by (used in) financing activities .... (357.2) (197.2) 267.7 — (286.7)
Increase (decrease) in cash and cash equivalents .... (15.1) (0.9) (2.9) — (18.9)
Beginning cash and cash equivalents .............. 38.6 2.6 3.7 — 44.9
Ending cash and cash equivalents ................. $ 23.5 $ 1.7 $ 0.8 $— $ 26.0
100