Cincinnati Bell 2004 Annual Report Download - page 162
Download and view the complete annual report
Please find page 162 of the 2004 Cincinnati Bell annual report below. You can navigate through the pages in the report by either clicking on the pages listed below, or by using the keyword search tool below to find specific information within the annual report.-
 1
1 -
2
-
3
-
4
-
5
-
6
-
7
-
8
-
9
-
10
-
11
-
12
-
13
-
14
-
15
-
16
-
17
-
18
-
19
-
20
-
21
-
22
-
23
-
24
-
25
-
26
-
27
-
28
-
29
-
30
-
31
-
32
-
33
-
34
-
35
-
36
-
37
-
38
-
39
-
40
-
41
-
42
-
43
-
44
-
45
-
46
-
47
-
48
-
49
-
50
-
51
-
52
-
53
-
54
-
55
-
56
-
57
-
58
-
59
-
60
-
61
-
62
-
63
-
64
-
65
-
66
-
67
-
68
-
69
-
70
-
71
-
72
-
73
-
74
-
75
-
76
-
77
-
78
-
79
-
80
-
81
-
82
-
83
-
84
-
85
-
86
-
87
-
88
-
89
-
90
-
91
-
92
-
93
-
94
-
95
-
96
-
97
-
98
-
99
-
100
-
101
-
102
-
103
-
104
-
105
-
106
-
107
-
108
-
109
-
110
-
111
-
112
-
113
-
114
-
115
-
116
-
117
-
118
-
119
-
120
-
121
-
122
-
123
-
124
-
125
-
126
-
127
-
128
-
129
-
130
-
131
-
132
-
133
-
134
-
135
-
136
-
137
-
138
-
139
-
140
-
141
-
142
-
143
-
144
-
145
-
146
-
147
-
148
-
149
-
150
-
151
-
 152
152 -
 153
153 -
 154
154 -
 155
155 -
 156
156 -
 157
157 -
 158
158 -
 159
159 -
 160
160 -
 161
161 -
 162
162 -
 163
163 -
 164
164 -
 165
165 -
 166
166 -
 167
167 -
 168
168 -
 169
169 -
 170
170 -
 171
171 -
 172
172 -
173
-
174
-
175
-
176
-
177
-
178
-
179
-
180
-
181
-
182
-
183
-
184
-
185
-
186
-
187
-
188
-
189
-
190
-
191
-
192
-
193
-
194
-
195
-
196
-
197
-
198
-
199
-
200
 |
 |

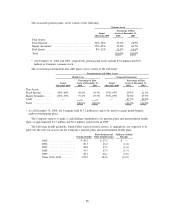
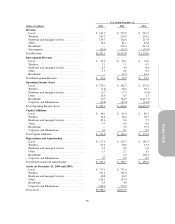
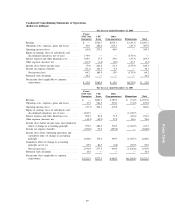
The associated pension plans’ assets consist of the following:
Pension Assets
Percentage of Plan
Assets at December 31,
Target
Allocation 2005 2004 2003
Plan Assets:
Fixed Income ....................................... 20%–38% 28.6% 28.9%
Equity Securities* .................................. 55%–65% 59.9% 60.5%
Real Estate .......................................... 8%–12% 11.5% 10.6%
Total ................................................ 100.0% 100.0%
* At December 31, 2004 and 2003, respectively, pension plan assets include $5.8 million and $7.0
million in Company common stock.
The associated postretirement and other plans’ assets consist of the following:
Postretirement and Other Assets
Health Care Group Life Insurance
Percentage of Plan
Assets at December 31,
Percentage of Plan
Assets at December 31,
Target
Allocation 2005 2004 2003
Target
Allocation 2004 2004 2003
Plan Assets:
Fixed Income ......... 30%–40% 42.8% 36.3% 35%–45% 20.3% 21.1%
Equity Securities ...... 60%–70% 57.2% 63.7% 55%–65% 32.0% 29.7%
Cash* ................. — — — — 47.7% 49.2%
Total .................. 100.0% 100.0% 100.0% 100.0%
* As of December 31, 2004, the Company held $13.2 million in cash to be used for group health benefits
under postretirement plans.
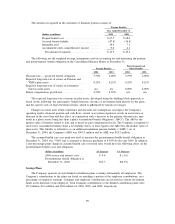
The Company expects to make a cash funding contribution to its pension plans and postretirement health
plans of approximately $2.5 million and $9.2 million, respectively in 2005.
The following benefit payments, which reflect expected future service, as appropriate, are expected to be
paid over the next ten years from the Company’s pension plans and postretirement health plans:
Pension Benefits
Postretirement and
Other Benefits Gross
Medicare Subsidy
Receipts
2005 ........................ $ 49.2 $ 25.2 $ —
2006 ........................ 60.3 26.2 (1.4)
2007 ........................ 40.0 27.1 (1.6)
2008 ........................ 39.7 27.7 (1.7)
2009 ........................ 40.1 28.1 (1.8)
Years 2010–2014 ............ 199.2 144.6 (12.0)
88