Cincinnati Bell 2004 Annual Report Download - page 114
Download and view the complete annual report
Please find page 114 of the 2004 Cincinnati Bell annual report below. You can navigate through the pages in the report by either clicking on the pages listed below, or by using the keyword search tool below to find specific information within the annual report.-
 1
1 -
2
-
3
-
4
-
5
-
6
-
7
-
8
-
9
-
10
-
11
-
12
-
13
-
14
-
15
-
16
-
17
-
18
-
19
-
20
-
21
-
22
-
23
-
24
-
25
-
26
-
27
-
28
-
29
-
30
-
31
-
32
-
33
-
34
-
35
-
36
-
37
-
38
-
39
-
40
-
41
-
42
-
43
-
44
-
45
-
46
-
47
-
48
-
49
-
50
-
51
-
52
-
53
-
54
-
55
-
56
-
57
-
58
-
59
-
60
-
61
-
62
-
63
-
64
-
65
-
66
-
67
-
68
-
69
-
70
-
71
-
72
-
73
-
74
-
75
-
76
-
77
-
78
-
79
-
80
-
81
-
82
-
83
-
84
-
85
-
86
-
87
-
88
-
89
-
90
-
91
-
92
-
93
-
94
-
95
-
96
-
97
-
98
-
99
-
100
-
101
-
102
-
103
-
 104
104 -
 105
105 -
 106
106 -
 107
107 -
 108
108 -
 109
109 -
 110
110 -
 111
111 -
 112
112 -
 113
113 -
 114
114 -
 115
115 -
 116
116 -
 117
117 -
 118
118 -
 119
119 -
 120
120 -
 121
121 -
 122
122 -
 123
123 -
 124
124 -
125
-
126
-
127
-
128
-
129
-
130
-
131
-
132
-
133
-
134
-
135
-
136
-
137
-
138
-
139
-
140
-
141
-
142
-
143
-
144
-
145
-
146
-
147
-
148
-
149
-
150
-
151
-
152
-
153
-
154
-
155
-
156
-
157
-
158
-
159
-
160
-
161
-
162
-
163
-
164
-
165
-
166
-
167
-
168
-
169
-
170
-
171
-
172
-
173
-
174
-
175
-
176
-
177
-
178
-
179
-
180
-
181
-
182
-
183
-
184
-
185
-
186
-
187
-
188
-
189
-
190
-
191
-
192
-
193
-
194
-
195
-
196
-
197
-
198
-
199
-
200
 |
 |

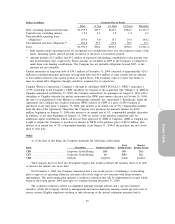
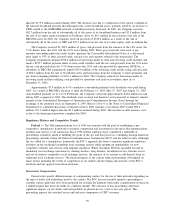
(dollars in millions) 2004 2003
$ Change
2004 vs.
2003
% Change
2004 vs.
2003 2002
$ Change
2003 vs.
2002
% Change
2003 vs.
2002
Revenue
Broadband transport ........................ $ — 159.3 $(159.3) (100)% $ 461.6 (302.3) (66)%
Switched voice services .................... — 111.9 (111.9) (100)% 335.9 (224.0) (67)%
Data and Internet ........................... — 59.5 (59.5) (100)% 112.6 (53.1) (47)%
Network construction and other services . . . — 1.7 (1.7) (100)% 1.3 0.4 31%
Total revenue ............................... — 332.4 (332.4) (100)% 911.4 (579.0) (64)%
Costs, expenses, gains and losses:
Cost of services and products .............. — 202.8 (202.8) (100)% 519.4 (316.6) (61)%
Selling, general and administrative ......... (3.7) 125.2 (128.9) n/m 284.5 (159.3) (56)%
Depreciation ................................ — 1.9 (1.9) (100)% 284.7 (282.8) (99)%
Amortization ............................... — — — n/m 24.8 (24.8) (100)%
Restructuring ............................... (1.8) (11.1) 9.3 84% 32.5 (43.6) n/m
Asset impairments and other charges ....... (1.5) 5.8 (7.3) n/m 2,181.2 (2,175.4) (100)%
Gain on sale of broadband assets ........... (3.7) (336.7) 333.0 99% — (336.7) n/m
Total costs, expenses, gains and losses ..... (10.7) (12.1) 1.4 12% 3,327.1 (3,339.2) (100)%
Operating income (loss) ...................... $ 10.7 $ 344.5 $(333.8) (97)% $(2,415.7) 2,760.2 n/m
Operating margin ............................. n/m n/m n/m n/m n/m
2004 Compared to 2003
Revenue
Broadband segment revenue decreased 100% in 2004 compared to 2003 due to the sale of substantially
all of the Company’s broadband assets.
Costs and Expenses
Cost of services and products in 2003 primarily reflects access charges paid to local exchange carriers
and other providers, transmission lease payments to other carriers and costs incurred for network construction
projects. In 2004, cost of services and products amounted to zero, compared to $202.8 million incurred during
2003, due to the sale of substantially all of the Company’s broadband assets.
During 2004, SG&A expenses primarily consisted of the reversal of certain operating tax reserves
totaling $3.5 million. SG&A expenses decreased due to reversals of $3.7 million in 2004 from an expense of
$125.2 million in 2003 due to the sale of substantially all of the Company’s broadband assets.
During 2004, the Broadband segment recorded a restructuring credit of $1.8 million due to a change in
estimate related to the termination of contractual obligations. The restructuring credit was offset by a corporate
restructuring adjustment of $2.0 million. Refer to Note 5 of the Notes to Consolidated Financial Statements.
The Broadband segment recorded a gain of $1.5 million in 2004 related to the sale of assets previously
written off.
The gain on sale of $3.7 million recorded in 2004 was due to the expiration of certain indemnities to
the buyer. Refer to Note 10 of the Notes to Consolidated Financial Statements.
2003 Compared to 2002
Revenue
Broadband segment revenue decreased significantly in 2003 due to the sale of substantially all of the
Company’s broadband assets on June 13, 2003. Prior to the aforementioned sale of the broadband assets, the
Broadband segment had revenue from broadband transport, voice long distance and other data and Internet
40