Cincinnati Bell 2004 Annual Report Download - page 165
Download and view the complete annual report
Please find page 165 of the 2004 Cincinnati Bell annual report below. You can navigate through the pages in the report by either clicking on the pages listed below, or by using the keyword search tool below to find specific information within the annual report.-
 1
1 -
2
-
3
-
4
-
5
-
6
-
7
-
8
-
9
-
10
-
11
-
12
-
13
-
14
-
15
-
16
-
17
-
18
-
19
-
20
-
21
-
22
-
23
-
24
-
25
-
26
-
27
-
28
-
29
-
30
-
31
-
32
-
33
-
34
-
35
-
36
-
37
-
38
-
39
-
40
-
41
-
42
-
43
-
44
-
45
-
46
-
47
-
48
-
49
-
50
-
51
-
52
-
53
-
54
-
55
-
56
-
57
-
58
-
59
-
60
-
61
-
62
-
63
-
64
-
65
-
66
-
67
-
68
-
69
-
70
-
71
-
72
-
73
-
74
-
75
-
76
-
77
-
78
-
79
-
80
-
81
-
82
-
83
-
84
-
85
-
86
-
87
-
88
-
89
-
90
-
91
-
92
-
93
-
94
-
95
-
96
-
97
-
98
-
99
-
100
-
101
-
102
-
103
-
104
-
105
-
106
-
107
-
108
-
109
-
110
-
111
-
112
-
113
-
114
-
115
-
116
-
117
-
118
-
119
-
120
-
121
-
122
-
123
-
124
-
125
-
126
-
127
-
128
-
129
-
130
-
131
-
132
-
133
-
134
-
135
-
136
-
137
-
138
-
139
-
140
-
141
-
142
-
143
-
144
-
145
-
146
-
147
-
148
-
149
-
150
-
151
-
152
-
153
-
154
-
 155
155 -
 156
156 -
 157
157 -
 158
158 -
 159
159 -
 160
160 -
 161
161 -
 162
162 -
 163
163 -
 164
164 -
 165
165 -
 166
166 -
 167
167 -
 168
168 -
 169
169 -
 170
170 -
 171
171 -
 172
172 -
 173
173 -
 174
174 -
 175
175 -
176
-
177
-
178
-
179
-
180
-
181
-
182
-
183
-
184
-
185
-
186
-
187
-
188
-
189
-
190
-
191
-
192
-
193
-
194
-
195
-
196
-
197
-
198
-
199
-
200
 |
 |

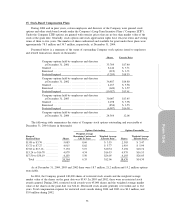
15. Stock-Based Compensation Plans
During 2004 and in prior years, certain employees and directors of the Company were granted stock
options and other stock-based awards under the Company’s Long-Term Incentive Plans (“Company LTIP”).
Under the Company LTIP, options are granted with exercise prices that are no less than market value of the
stock at the grant date. Generally, stock options and stock appreciation rights have ten-year terms and vesting
terms of three to five years. The number of shares authorized and available for grant under these plans were
approximately 78.3 million and 34.7 million, respectively, at December 31, 2004.
Presented below is a summary of the status of outstanding Company stock options issued to employees
and related transactions (shares in thousands):
Shares Exercise Price
Company options held by employees and directors
at December 31, 2001 ............................ 33,769 $17.40
Granted ............................................. 8,142 $ 3.71
Exercised ........................................... (219) $ 3.71
Forfeited/expired .................................... (5,205) $18.55
Company options held by employees and directors
at December 31, 2002 ............................ 36,487 $14.80
Granted ............................................. 4,167 $ 5.58
Exercised ........................................... (620) $ 3.57
Forfeited/expired .................................... (10,027) $15.61
Company options held by employees and directors
at December 31, 2003 ............................ 30,007 $13.45
Granted ............................................. 2,198 $ 3.98
Exercised ........................................... (854) $ 3.55
Forfeited/expired .................................... (6,987) $16.58
Company options held by employees and directors
at December 31, 2004 ............................ 24,364 12.06
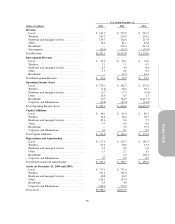
The following table summarizes the status of Company stock options outstanding and exercisable at
December 31, 2004 (shares in thousands):
Options Outstanding Options Exercisable
Range of
Exercise Prices Shares
Weighted Average
Remaining Contractual
Life in Years
Weighted Average
Exercise Price Shares
Weighted Average
Exercise Price
$1.88 to $3.70 .............. 5,083 8.60 $ 3.55 2,385 $ 3.47
$3.72 to $7.27 .............. 4,915 8.02 $ 5.77 1,919 $ 5.99
$7.68 to $13.16 ............. 5,194 5.19 $10.74 5,194 $10.74
$13.24 to $16.78 ............ 4,979 4.34 $16.53 4,979 $16.53
$17.50 to $38.19 ............ 4,193 5.50 $26.05 4,193 $26.05
Total ..................... 24,364 6.35 $12.06 18,670 $14.30
As of December 31, 2004, 2003 and 2002 there were 18.7 million, 21.2 million and 19.2 million options
exercisable.
In 2004, the Company granted 140,000 shares of restricted stock awards and the weighted average
market value of the shares on the grant date was $5.43. In 2003 and 2002, there were no restricted stock
awards granted. During 2001, restricted stock awards were 65,000 shares and the weighted average market
value of the shares on the grant date was $24.41. Restricted stock awards generally vest within one to five
years. Total compensation expense for restricted stock awards during 2004 and 2003 was $0.3 million, and
$3.8 million during 2002.
91
Form 10-K