Cincinnati Bell 2004 Annual Report Download - page 169
Download and view the complete annual report
Please find page 169 of the 2004 Cincinnati Bell annual report below. You can navigate through the pages in the report by either clicking on the pages listed below, or by using the keyword search tool below to find specific information within the annual report.-
 1
1 -
2
-
3
-
4
-
5
-
6
-
7
-
8
-
9
-
10
-
11
-
12
-
13
-
14
-
15
-
16
-
17
-
18
-
19
-
20
-
21
-
22
-
23
-
24
-
25
-
26
-
27
-
28
-
29
-
30
-
31
-
32
-
33
-
34
-
35
-
36
-
37
-
38
-
39
-
40
-
41
-
42
-
43
-
44
-
45
-
46
-
47
-
48
-
49
-
50
-
51
-
52
-
53
-
54
-
55
-
56
-
57
-
58
-
59
-
60
-
61
-
62
-
63
-
64
-
65
-
66
-
67
-
68
-
69
-
70
-
71
-
72
-
73
-
74
-
75
-
76
-
77
-
78
-
79
-
80
-
81
-
82
-
83
-
84
-
85
-
86
-
87
-
88
-
89
-
90
-
91
-
92
-
93
-
94
-
95
-
96
-
97
-
98
-
99
-
100
-
101
-
102
-
103
-
104
-
105
-
106
-
107
-
108
-
109
-
110
-
111
-
112
-
113
-
114
-
115
-
116
-
117
-
118
-
119
-
120
-
121
-
122
-
123
-
124
-
125
-
126
-
127
-
128
-
129
-
130
-
131
-
132
-
133
-
134
-
135
-
136
-
137
-
138
-
139
-
140
-
141
-
142
-
143
-
144
-
145
-
146
-
147
-
148
-
149
-
150
-
151
-
152
-
153
-
154
-
155
-
156
-
157
-
158
-
 159
159 -
 160
160 -
 161
161 -
 162
162 -
 163
163 -
 164
164 -
 165
165 -
 166
166 -
 167
167 -
 168
168 -
 169
169 -
 170
170 -
 171
171 -
 172
172 -
 173
173 -
 174
174 -
 175
175 -
 176
176 -
 177
177 -
 178
178 -
 179
179 -
180
-
181
-
182
-
183
-
184
-
185
-
186
-
187
-
188
-
189
-
190
-
191
-
192
-
193
-
194
-
195
-
196
-
197
-
198
-
199
-
200
 |
 |
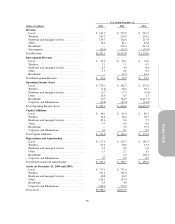
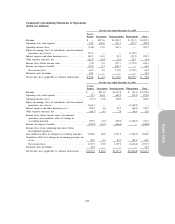
Year Ended December 31,
(dollars in millions) 2004 2003 2002
Revenue
Local ............................................. $ 761.7 $ 774.5 $ 781.7
Wireless .......................................... 261.7 259.5 267.2
Hardware and managed services .................. 134.7 162.8 215.4
Other ............................................. 78.6 81.1 82.8
Broadband ........................................ — 332.4 911.4
Intersegment ..................................... (29.6) (52.5) (79.9)
Total Revenue ...................................... $1,207.1 $1,557.8 $ 2,178.6
Intersegment Revenue
Local ............................................. $ 21.1 $ 27.1 $ 35.6
Wireless .......................................... 2.1 1.1 0.3
Hardware and managed services .................. 4.5 4.4 0.6
Other ............................................. 1.9 0.6 0.2
Broadband ........................................ — 19.3 43.2
Total Intersegment Revenue ........................ $ 29.6 $ 52.5 $ 79.9
Operating Income (Loss)
Local ............................................. $ 279.1 $ 282.7 $ 272.8
Wireless .......................................... (1.4) 60.2 69.1
Hardware and managed services .................. 12.7 17.5 (9.4)
Other ............................................. 18.0 6.5 1.7
Broadband ........................................ 10.7 344.5 (2,415.7)
Corporate and Eliminations ...................... (19.8) (27.4) (12.0)
Total Operating Income (Loss) ...................... $ 299.3 $ 684.0 $(2,093.5)
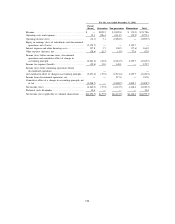
Capital Additions
Local ............................................. $ 80.1 $ 81.0 $ 80.3
Wireless .......................................... 32.4 40.2 29.5
Hardware and managed services .................. 15.6 0.6 5.7
Other ............................................. 5.7 0.9 0.9
Broadband ........................................ — 3.6 59.2
Corporate and Eliminations ...................... 0.1 0.1 0.3
Total Capital Additions ............................. $ 133.9 $ 126.4 $ 175.9
Depreciation and Amortization
Local ............................................. $ 117.2 $ 125.7 $ 146.7
Wireless .......................................... 67.4 38.8 31.3
Hardware and managed services .................. 1.1 0.7 6.4
Other ............................................. 1.7 2.1 1.9
Broadband ........................................ — 1.9 309.4
Corporate and Eliminations ...................... 0.3 0.5 0.6
Total Depreciation and Amortization ................ $ 187.7 $ 169.7 $ 496.3
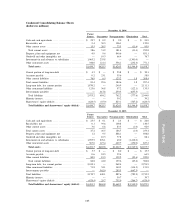
Assets (at December 31, 2004 and 2003)
Local ............................................. $ 717.1 $ 771.9
Wireless .......................................... 371.6 391.8
Hardware and managed services .................. 60.8 44.9
Other ............................................. 124.1 123.9
Broadband ........................................ 2.9 4.0
Corporate and Eliminations ...................... 682.2 737.0
Total Assets ......................................... $1,958.7 $2,073.5
95
Form 10-K