CVS 2005 Annual Report Download - page 43
Download and view the complete annual report
Please find page 43 of the 2005 CVS annual report below. You can navigate through the pages in the report by either clicking on the pages listed below, or by using the keyword search tool below to find specific information within the annual report.-
 1
1 -
2
-
3
-
4
-
5
-
6
-
7
-
8
-
9
-
10
-
11
-
12
-
13
-
14
-
15
-
16
-
17
-
18
-
19
-
20
-
21
-
22
-
23
-
24
-
25
-
26
-
27
-
28
-
29
-
30
-
31
-
32
-
 33
33 -
 34
34 -
 35
35 -
 36
36 -
 37
37 -
 38
38 -
 39
39 -
 40
40 -
 41
41 -
 42
42 -
 43
43 -
 44
44 -
 45
45 -
 46
46 -
 47
47 -
 48
48 -
 49
49 -
 50
50 -
 51
51 -
 52
52
 |
 |

41
NOTES TO CONSOLIDATED FINANCIAL STATEMENTS
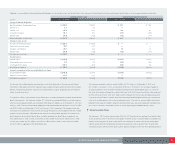
Following is a reconciliation of the Company’s business segments to the consolidated financial statements:
In millions Retail Pharmacy Segment PBM Segment Intersegment Eliminations Consolidated Totals
2005: Net sales $ 34,094.6 $ 2,956.2 $ (44.6) $ 37,006.2
Operating profit 1,797.1 222.4 —2,019.5
Depreciation and amortization 548.5 40.6 —589.1
Total assets 13,878.5 1,404.9 —15,283.4
Goodwill 1,152.4 637.5 —1,789.9
Additions to property and equipment 1,471.3 24.1 —1,495.4
2004: Net sales $ 28,728.7 $ 1,865.6 $ — $ 30,594.3
Operating profit 1,320.8 133.9 —1,454.7
Depreciation and amortization 471.1 25.7 — 496.8
Total assets 13,118.5 1,428.3 — 14,546.8
Goodwill 1,257.4 641.1 —1,898.5
Additions to property and equipment 1,341.5 6.2 —1,347.7
2003: Net sales $ 25,280.7 $ 1,307.3 $ — $ 26,588.0
Operating profit 1,323.1 100.5 —1,423.6
Depreciation and amortization 326.5 15.2 — 341.7
Total assets 9,975.0 568.1 — 10,543.1
Goodwill 690.4 198.6 —889.0
Additions to property and equipment 1,114.2 7.5 —1,121.7
11 Business Segments
The Company currently operates two business segments, Retail Pharmacy and Pharmacy Benefit
Management (“PBM”). The operating segments are segments of the Company for which separate financial
information is available and for which operating results are evaluated regularly by executive management in
deciding how to allocate resources and in assessing performance.
As of December 31, 2005, the Retail Pharmacy segment included 5,420 retail drugstores and the
Company’s online retail website, CVS.com.
®The retail drugstores are located in 34 states and the District
of Columbia and operate under the CVS®or CVS/pharmacy®name.
The PBM segment provides a full range of prescription benefit management services to managed care
providers and other organizations. These services include mail order pharmacy services, specialty pharmacy
services, plan design and administration, formulary management and claims processing. The specialty
pharmacy business focuses on supporting individuals that require complex and expensive drug therapies.
The PBM segment operates under the PharmaCare Management Services and PharmaCare Pharmacy®
names and includes 51 retail pharmacies, located in 21states and the District of Columbia.
The Company evaluates segment performance based on operating profit before the effect of non-recurring
charges and gains and certain intersegment activities and charges, including pharmacy revenues reported
by the retail segment that are directly related to premium revenues that are reported by the PBM segment.
The accounting policies of the segments are substantially the same as those described in Note 1.
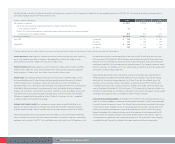
Following is a reconciliation of the significant components of the Company’s net sales for the respective years:
2005 2004 2003
Pharmacy 70.2% 70.0% 68.8%
Front store 29.8 30.0 31.2
100.0% 100.0% 100.0%