CVS 2005 Annual Report Download - page 38
Download and view the complete annual report
Please find page 38 of the 2005 CVS annual report below. You can navigate through the pages in the report by either clicking on the pages listed below, or by using the keyword search tool below to find specific information within the annual report.-
 1
1 -
2
-
3
-
4
-
5
-
6
-
7
-
8
-
9
-
10
-
11
-
12
-
13
-
14
-
15
-
16
-
17
-
18
-
19
-
20
-
21
-
22
-
23
-
24
-
25
-
26
-
27
-
 28
28 -
 29
29 -
 30
30 -
 31
31 -
 32
32 -
 33
33 -
 34
34 -
 35
35 -
 36
36 -
 37
37 -
 38
38 -
 39
39 -
 40
40 -
 41
41 -
 42
42 -
 43
43 -
 44
44 -
 45
45 -
 46
46 -
 47
47 -
 48
48 -
49
-
50
-
51
-
52
 |
 |

36 CVS CORPORATION 2005 ANNUAL REPORT
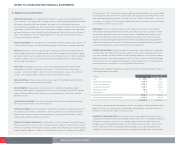
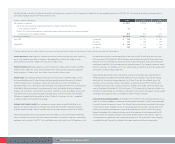
Following is a summary of the net periodic pension cost for the defined benefit and other postretirement benefit plans for the respective years:
DEFINED BENEFIT PLANS OTHER POSTRETIREMENT BENEFITS
In millions 2005 2004 2003 2005 2004 2003
Service cost $ 0.7 $ 0.9 $ 0.8 $ — $ — $ —
Interest cost on benefit obligation 21.4 20.5 20.5 0.6 0.7 0.8
Expected return on plan assets (19.4) (18.6) (18.4) —— —
Amortization of net loss (gain) 6.6 3.3 1.5 (0.2) —(0.1)
Amortization of prior service cost 0.1 0.1 0.1 (0.1) (0.1) (0.1)
Net periodic pension cost $ 9.4 $ 6.2 $ 4.5 $ 0.3 $ 0.6 $ 0.6
Actuarial assumptions used to determine net period pension cost:
Discount rate 6.00% 6.25% 6.50% 6.00% 6.25% 6.50%
Expected return on plan assets 8.50% 8.50% 8.75% —— —
Actuarial assumptions used to determine benefit obligations:
Discount rate 5.75% 6.00% 6.25% 5.75% 6.00% 6.25%
Expected return on plan assets 8.50% 8.50% 8.50% —— —
Rate of compensation increase 4.00% 4.00% 4.00% —— —
Pursuant to various labor agreements, the Company is also required to make contributions to certain
union-administered pension and health and welfare plans that totaled $15.4 million in 2005, $15.0 million
in 2004 and $13.2 million in 2003. The Company also has nonqualified supplemental executive retirement
plans in place for certain key employees for whom it has purchased cost recovery variable life insurance.
The Company uses an investment strategy, which emphasizes equities in order to produce higher expected
returns, and in the long run, lower expected expense and cash contribution requirements. The pension plan
assets allocation targets 70% equity and 30% fixed income.
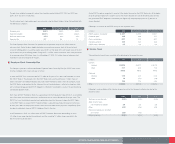
Following is the pension plan assets allocation by major category for the respective years:
2005 2004
Equity 70% 70%
Fixed income 29% 29%
Other 1% 1%
100% 100%
The equity investments primarily consist of large cap value and international value equity funds. The fixed
income investments primarily consist of intermediate-term bond funds. The other category consists of cash
and cash equivalents held for benefit payments.