CVS 2005 Annual Report Download - page 41
Download and view the complete annual report
Please find page 41 of the 2005 CVS annual report below. You can navigate through the pages in the report by either clicking on the pages listed below, or by using the keyword search tool below to find specific information within the annual report.-
 1
1 -
2
-
3
-
4
-
5
-
6
-
7
-
8
-
9
-
10
-
11
-
12
-
13
-
14
-
15
-
16
-
17
-
18
-
19
-
20
-
21
-
22
-
23
-
24
-
25
-
26
-
27
-
28
-
29
-
30
-
 31
31 -
 32
32 -
 33
33 -
 34
34 -
 35
35 -
 36
36 -
 37
37 -
 38
38 -
 39
39 -
 40
40 -
 41
41 -
 42
42 -
 43
43 -
 44
44 -
 45
45 -
 46
46 -
 47
47 -
 48
48 -
 49
49 -
 50
50 -
 51
51 -
52
 |
 |

39
NOTES TO CONSOLIDATED FINANCIAL STATEMENTS
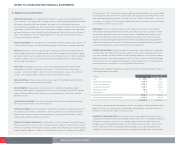
The per share weighted average fair value of stock options granted during 2005, 2004 and 2003 was
$8.46, $6.47 and $4.51, respectively.
The fair value of each stock option grant was estimated using the Black-Scholes Option Pricing Model with
the following assumptions:
2005 2004 2003
Dividend yield 0.56% 0.65% 0.85%
Expected volatility 34.00% 30.50% 29.63%
Risk-free interest rate 4.3% 3.9% 3.5%
Expected life 5.7 6.6 7.0
The 1999 Employee Stock Purchase Plan provides for the purchase of up to 14.8 million shares of
common stock. Under the plan, eligible employees may purchase common stock at the end of each
six-month offering period, at a purchase price equal to 85% of the lower of the fair market value on the first
day or the last day of the offering period. During 2005, 1.3 million shares of common stock were purchased
at an average price of $18.88 per share. As of December 31, 2005, 10.0 million shares of common stock
have been issued since inception of the plan.
8Employee Stock Ownership Plan
The Company sponsors a defined contribution Employee Stock Ownership Plan (the “ESOP”) that covers
full-time employees with at least one year of service.
In 1989, the ESOP Trust issued and sold $357.5 million of 20-year, 8.52% notes due December 31, 2008
(the “ESOP Notes”). The proceeds from the ESOP Notes were used to purchase 6.7 million shares of
Series One ESOP Convertible Preference Stock (the “ESOP Preference Stock”) from the Company. Since
the ESOP Notes are guaranteed by the Company, the outstanding balance is reflected as long-term debt,
and a corresponding guaranteed ESOP obligation is reflected in shareholders’ equity in the accompanying
consolidated balance sheets.
Each share of ESOP Preference Stock has a guaranteed minimum liquidation value of $53.45, is convertible
into 4.628 shares of common stock and is entitled to receive an annual dividend of $3.90 per share. The
ESOP Trust uses the dividends received and contributions from the Company to repay the ESOP Notes.
As the ESOP Notes are repaid, ESOP Preference Stock is allocated to participants based on (i) the ratio
of each year’s debt service payment to total current and future debt service payments multiplied by (ii) the
number of unallocated shares of ESOP Preference Stock in the plan.
As of December 31, 2005, 4.2 million shares of ESOP Preference Stock were outstanding, of which
3.0 million shares were allocated to participants and the remaining 1.2 million shares were held in the
ESOP Trust for future allocations.
Annual ESOP expense recognized is equal to (i) the interest incurred on the ESOP Notes plus (ii) the higher
of (a) the principal repayments or (b) the cost of the shares allocated, less (iii) the dividends paid. Similarly,
the guaranteed ESOP obligation is reduced by the higher of (i) the principal payments or (ii) the cost of
shares allocated.
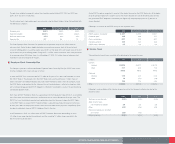
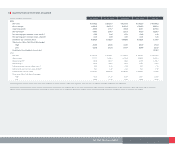
Following is a summary of the ESOP activity for the respective years:
In millions 2005 2004 2003
ESOP expense recognized $ 22.7 $ 19.5 $ 30.1
Dividends paid 16.2 16.6 17.7
Cash contributions 22.7 19.5 30.1
Interest payments 12.0 13.9 16.6
ESOP shares allocated 0.3 0.3 0.4
9Income Taxes
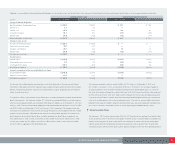
The provision for income taxes consisted of the following for the respective years:
In millions 2005 2004 2003
Current:
Federal $ 632.8 $ 397.7 $ 421.5
State 31.7 62.6 77.3
664.5 460.3 498.8
Deferred:
Federal 17.9 22.5 31.0
State 1.9 (5.2) (1.6)
19.8 17.3 29.4
Total $ 684.3 $ 477.6 $ 528.2
Following is a reconciliation of the statutory income tax rate to the Company’s effective tax rate for the
respective years:
2005 2004 2003
Statutory income tax rate 35.0% 35.0% 35.0%
State income taxes,
net of federal tax benefit 3.9 3.8 3.6
Other (0.3) (0.3) (0.2)
Reversal of previously recorded
tax reserves (2.8) (4.3) —
Effective tax rate 35.8% 34.2% 38.4%