CVS 2005 Annual Report Download - page 21
Download and view the complete annual report
Please find page 21 of the 2005 CVS annual report below. You can navigate through the pages in the report by either clicking on the pages listed below, or by using the keyword search tool below to find specific information within the annual report.-
 1
1 -
2
-
3
-
4
-
5
-
6
-
7
-
8
-
9
-
10
-
 11
11 -
 12
12 -
 13
13 -
 14
14 -
 15
15 -
 16
16 -
 17
17 -
 18
18 -
 19
19 -
 20
20 -
 21
21 -
 22
22 -
 23
23 -
 24
24 -
 25
25 -
 26
26 -
 27
27 -
 28
28 -
 29
29 -
 30
30 -
 31
31 -
32
-
33
-
34
-
35
-
36
-
37
-
38
-
39
-
40
-
41
-
42
-
43
-
44
-
45
-
46
-
47
-
48
-
49
-
50
-
51
-
52
 |
 |

19
MANAGEMENT’S DISCUSSION AND ANALYSIS OF FINANCIAL CONDITION AND RESULTS OF OPERATIONS
%Our pharmacy sales growth has also been adversely affected by the growth of the mail order channel,
a decline in the number of significant new drug introductions, higher consumer co-payments and
co-insurance arrangements and an increase in the number of over-the-counter remedies that had
historically only been available by prescription. To address the growth in mail order, we may choose
not to participate in certain prescription benefit programs that mandate filling maintenance prescriptions
through a mail order service facility. In the event we elect to, for any reason, withdraw from current
programs and/or decide not to participate in future programs, we may not be able to sustain our
current rate of sales growth.
GROSS MARGIN, which includes net sales less the cost of merchandise sold during the reporting period and
the related purchasing costs, warehousing costs, delivery costs and actual and estimated inventory losses, as
a percentage of net sales was 26.8% in 2005. This compares to 26.3% in 2004 and 25.8% in 2003. As you
review our gross margin performance, we believe you should consider the following important information:
%Our pharmacy gross margin rate continued to benefit from an increase in generic drug sales in 2005,
which normally yield a higher gross margin than equivalent brand name drug sales.
%Our gross margin rate continued to benefit from reduced inventory losses as a result of new and
continuing programs implemented in our existing stores and the Acquired Businesses. While we believe
these programs will continue to provide operational benefits, particularly for the Acquired Businesses,
we expect the future financial improvement to be less significant. In addition, we cannot guarantee that
our programs will continue to reduce inventory losses.
%Our gross margin rate continues to be adversely affected by pharmacy sales growing at a faster pace
than front store sales. On average, our gross margin on pharmacy sales is lower than our gross margin
on front store sales. Pharmacy sales were 70.2% of total sales in 2005, compared to 70.0% in 2004
and 68.8% in 2003.
%Sales to customers covered by third party insurance programs have continued to increase and, thus,
have become a larger component of our total pharmacy business. On average, our gross margin on
third party pharmacy sales is lower than our gross margin on non-third party pharmacy sales. Third
party pharmacy sales were 94.1% of pharmacy sales in 2005 and 2004, compared to 93.2% in 2003.
We expect these negative trends to continue. In particular, the introduction of the new Medicare Part D
benefit is anticipated to increase utilization and decrease pharmacy gross margin rates as higher
margin business (such as cash and state Medicaid customers) migrate to Part D coverage. Further,
on February 8, 2006, the President signed into law the Deficit Reduction Act of 2005 (the “Act”). The
Act seeks to reduce federal spending by $3.6 billion over a five-year period by altering the Medicaid
reimbursement formula for multi-source (i.e., generic) drugs. According to the Congressional Budget
Office, retail pharmacies are expected to negotiate with individual states for higher dispensing fees
to mitigate the adverse effect of these changes. These changes take effect January 1, 2007 and
are expected to result in reduced Medicaid reimbursement rates for retail pharmacies. In addition,
the President’s proposed budget for fiscal year 2007 contains further reductions in the Medicaid
reimbursement formula for multi-source drugs. The extent of these reductions cannot be determined
at this time.
TOTAL OPERATING EXPENSES, which include store and administrative payroll, employee benefits, store
and administrative occupancy costs, selling expenses, advertising expenses, administrative expenses
and depreciation and amortization expense were 21.3% of net sales in 2005. This compares to 21.5% of
net sales in 2004 and 20.5% in 2003. As you review our total operating expenses, we believe you should
consider the following important information:
%Total operating expenses as a percentage of net sales continued to be impacted by an increase in the
sale of generic drugs, which typically have a lower selling price than their brand named equivalents.
Fiscal 2005 was also impacted by higher payroll and benefit costs.
%During the fourth quarter of 2004, we conformed our accounting for operating leases and leasehold
improvements to the views expressed by the Office of the Chief Accountant of the Securities and
Exchange Commission to the American Institute of Certified Public Accountants on February 7, 2005.
As a result, we recorded a $65.9 million non-cash pre-tax adjustment to total operating expenses,
which represents the cumulative effect of the adjustment for a period of approximately 20 years (the
“Lease Adjustment”). Since the Lease Adjustment was not material to 2004 or any previously reported
fiscal year, the cumulative effect was recorded in the fourth quarter of 2004. For internal comparisons,
management finds it useful to assess year-to-year performance excluding the Lease Adjustment,
which results in comparable 2004 total operating expenses as a percentage of net sales of 21.3%.
%Total operating expenses as a percentage of net sales also increased during 2004 due to integration
and incremental costs as a result of the acquisition of the Acquired Businesses. In addition, the
acquired stores had lower average sales per store during 2004, increasing operating expenses as
a percentage of net sales.
%Fiscal 2004 and 2003 were impacted by an increase in payroll and benefit costs driven by an increase
in the number of 24-hour and extended hour stores, as well as new stores.
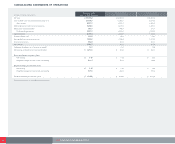
INTEREST EXPENSE, NET consisted of the following:
In millions 2005 2004 2003
Interest expense $ 117.0 $ 64.0 $ 53.9
Interest income (6.5) (5.7) (5.8)
Interest expense, net $ 110.5 $ 58.3 $ 48.1
The increase in interest expense, net during 2005 and 2004 was primarily driven by the increase in debt
used to fund the acquisition of the Acquired Businesses, which occurred during the third quarter of 2004.
INCOME TAX PROVISION– Our effective income tax rate was 35.8% in 2005, 34.2% in 2004 and
38.4% in 2003. As you review our income tax provision, we believe you should consider the following
important information:
%During the fourth quarter of 2005, an assessment of tax reserves resulted in a reduction that was
principally based on resolving certain state tax matters. As a result, the Company reversed $52.6 million
of previously recorded tax reserves through the income tax provision.