CVS 2005 Annual Report Download - page 39
Download and view the complete annual report
Please find page 39 of the 2005 CVS annual report below. You can navigate through the pages in the report by either clicking on the pages listed below, or by using the keyword search tool below to find specific information within the annual report.-
 1
1 -
2
-
3
-
4
-
5
-
6
-
7
-
8
-
9
-
10
-
11
-
12
-
13
-
14
-
15
-
16
-
17
-
18
-
19
-
20
-
21
-
22
-
23
-
24
-
25
-
26
-
27
-
28
-
 29
29 -
 30
30 -
 31
31 -
 32
32 -
 33
33 -
 34
34 -
 35
35 -
 36
36 -
 37
37 -
 38
38 -
 39
39 -
 40
40 -
 41
41 -
 42
42 -
 43
43 -
 44
44 -
 45
45 -
 46
46 -
 47
47 -
 48
48 -
 49
49 -
50
-
51
-
52
 |
 |

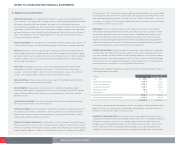
The discount rate is determined by examining the current yields observed on the measurement date of
fixed-interest, high quality investments expected to be available during the period to maturity of the related
benefits. The expected long-term rate of return is determined by using the target allocation and historical
returns for each asset class.
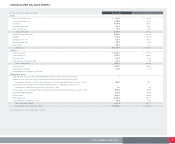
The Company utilized a measurement date of December 31to determine pension and other postretirement
benefit measurements. The Company included $17.1 million of accrued benefit liability in accrued expenses,
while the remaining benefit liability was recorded in other long-term liabilities, as of December 31, 2005 and
January 1, 2005. The accumulated benefit obligation for the defined benefit pension plans was $415.3 million
and $345.9 million as of December 31, 2005 and January 1, 2005, respectively. The Company estimates
it will make cash contributions to the pension plan during the next fiscal year of approximately $16.4 million,
however, actual contributions will depend on the outcome of funding reform legislation. Estimated future
benefit payments for the defined benefit plans and other postretirement benefit plans, respectively, are
$19.1 million and $1.3 million in 2006, $19.8 million and $1.3 million in 2007, $20.6 million and $1.3 million
in 2008, $21.3 million and $1.2 million in 2009, $22.2 million and $1.2 million in 2010 and $133.6 million
and $4.9 million in aggregate for the following five years.
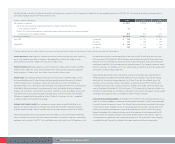
The Company recorded a minimum pension liability of $117.0 million as of December 31, 2005, and
$57.7 million as of January 1, 2005, as required by SFAS No. 87. During 2005, the Company engaged its
actuaries to perform a study to review the mortality experience of its defined benefit plans. As a result of
the study, the Company changed the mortality table used to the 1994 Group Annuity Basic Table, projected
to 2002 with Scale AA (the “2002 GATT Table”), which increased the minimum pension liability during 2005.
A minimum pension liability is required when the accumulated benefit obligation exceeds the combined fair
value of the underlying plan assets and accrued pension costs. The minimum pension liability adjustment is
reflected in other long-term liabilities, long-term deferred income taxes and accumulated other comprehensive
loss, which is included in shareholders’ equity, in the accompanying consolidated balance sheets.
7Stock Incentive Plans
The Company’s 1997 Incentive Compensation Plan (the “ICP”) provides for the granting of up to 85.8 million
shares of common stock in the form of stock options and other awards to selected officers, employees and
directors of the Company. All grants under the ICP are awarded at fair market value on the date of grant.
Options granted prior to 2004 generally become exercisable over a four-year period from the grant date
and expire ten years after the date of grant. Options granted during fiscal 2004 and 2005 generally become
37
NOTES TO CONSOLIDATED FINANCIAL STATEMENTS
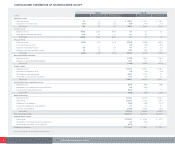
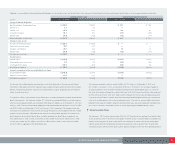
Following is a reconciliation of the projected benefit obligation, fair value of plan assets and funded status of the Company’s defined benefit and other postretirement benefit plans as of the respective balance sheet dates:
DEFINED BENEFIT PLANS OTHER POSTRETIREMENT BENEFITS
In millions Dec. 31, 2005 Jan. 1, 2005 Dec. 31, 2005 Jan. 1, 2005
Change in benefit obligation:
Benefit obligation at beginning of year $ 352.9 $ 339.1 $ 12.1 $ 13.3
Service cost 0.7 0.8 ——
Interest cost 21.4 20.5 0.6 0.7
Actuarial loss (gain) 65.1 10.1 (0.7) (0.5)
Benefits paid (18.9) (17.6) (1.3) (1.4)
Benefit obligation at end of year $ 421.2 $ 352.9 $ 10.7 $ 12.1
Change in plan assets:
Fair value at beginning of year $ 255.2 $ 226.6 $ — $ —
Actual return on plan assets 19.2 25.8 ——
Company contributions 20.1 20.4 1.3 1.4
Benefits paid (18.9) (17.6) (1.3) (1.4)
Fair value at end of year $ 275.6 $ 255.2 $ — $ —
Funded status:
Funded status $ (145.6) $(97.7) $ (10.7) $ (12.1)
Unrecognized prior service cost 0.3 0.5 (0.3) (0.4)
Unrecognized loss (gain) 122.6 63.8 (0.2) 0.3
Net liability recognized $(22.7) $(33.4) $ (11.2) $ (12.2)
Amounts recognized in the consolidated balance sheet:
Accrued benefit liability $ (139.7) $(91.1) $ (11.2) $ (12.2)
Minimum pension liability 117.0 57.7 ——
Net liability recognized $(22.7) $(33.4) $ (11.2) $ (12.2)