CVS 2005 Annual Report Download - page 40
Download and view the complete annual report
Please find page 40 of the 2005 CVS annual report below. You can navigate through the pages in the report by either clicking on the pages listed below, or by using the keyword search tool below to find specific information within the annual report.-
 1
1 -
2
-
3
-
4
-
5
-
6
-
7
-
8
-
9
-
10
-
11
-
12
-
13
-
14
-
15
-
16
-
17
-
18
-
19
-
20
-
21
-
22
-
23
-
24
-
25
-
26
-
27
-
28
-
29
-
 30
30 -
 31
31 -
 32
32 -
 33
33 -
 34
34 -
 35
35 -
 36
36 -
 37
37 -
 38
38 -
 39
39 -
 40
40 -
 41
41 -
 42
42 -
 43
43 -
 44
44 -
 45
45 -
 46
46 -
 47
47 -
 48
48 -
 49
49 -
 50
50 -
51
-
52
 |
 |

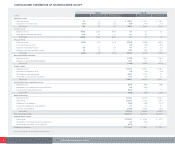
38 CVS CORPORATION 2005 ANNUAL REPORT
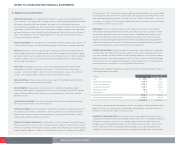
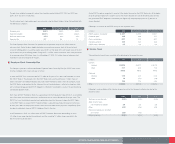
exercisable over a three-year period from the grant date and expire seven years after the date of grant.
As of December 31, 2005, there were 25.0 million shares available for future grants under the ICP.
The ICP allows for up to 7.2 million restricted shares to be issued. The Company granted 427,000, 824,000
and 426,000 shares of restricted stock with a weighted average per share grant date fair value of $24.80,
$18.41 and $12.63, in 2005, 2004 and 2003, respectively. In addition, the Company granted 812,000
restricted stock units with a weighted average fair value of $26.02 in 2005. The fair value of the restricted
shares and units are expensed over the period during which the restrictions lapse. Compensation costs for
restricted shares and units totaled $5.9 million in 2005, $2.4 million in 2004 and $3.6 million in 2003.
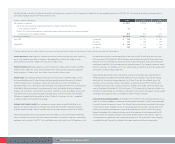
In 2004, an amendment to the Company’s ICP was approved by shareholders, allowing non-employee
directors to receive awards under the ICP. Upon approval of this amendment to the ICP, all authority to make
future grants under the Company’s 1996 Directors Stock Plan was terminated, although previously granted
awards remain outstanding in accordance with their terms and the terms of the 1996 Directors Stock Plan.
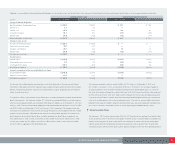
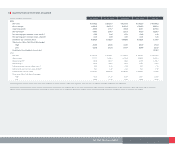
Following is a summary of the stock option activity for the respective years:
2005 2004 2003
weighted average weighted average weighted average
Shares in thousands shares exercise price shares exercise price shares exercise price
Outstanding at beginning of year 49,828 $ 17.58 54,158 $ 17.11 46,780 $ 18.21
Granted 5,790 22.53 5,864 17.75 12,802 12.61
Exercised (10,072) 14.47 (7,564) 13.88 (1,414) 10.13
Cancelled (1,929) 19.41 (2,630) 19.09 (4,010) 17.92
Outstanding at end of year 43,617 18.82 49,828 17.58 54,158 17.11
Exercisable at end of year 26,408 $ 19.82 25,098 $ 19.49 29,740 $ 17.77
Following is a summary of the stock options outstanding and exercisable as of December 31, 2005:
OPTIONS OUTSTANDING OPTIONS EXERCISABLE
number weighted average weighted average number weighted average
Shares in thousands outstanding remaining life exercise price exercisable exercise price
Range of Exercise Prices
$6.87 to $ 12.48 1,321 1.4 $ 11.25 1,252 $ 11.18
12.49 to 12.56 8,180 7.0 12.56 3,152 12.56
12.57 to 14.96 8,273 6.0 14.91 5,446 14.93
14.97 to 17.67 7,493 6.5 17.01 3,906 16.46
17.68 to 22.45 10,107 6.3 20.86 4,502 18.94
22.46 to 30.61 8,243 4.9 29.29 8,150 29.30
Total 43,617 6.0 $ 18.82 26,408 $ 19.82
The Company applies APB Opinion No. 25 to account for its stock incentive plans. Accordingly, no compensation cost has been recognized for stock options granted. Had compensation cost been recognized based on the fair
value of stock options granted, consistent with SFAS No. 123, net earnings and net earnings per common share (“EPS”) would approximate the pro forma amounts shown below:
In millions, except per share amounts 2005 2004 2003
Net earnings:
As reported $ 1,224.7 $ 918.8 $ 847.3
Pro forma 1,180.9 880.1 797.1
Basic EPS:
As reported $1.49 $ 1.13 $ 1.06
Pro forma 1.44 1.09 0.99
Diluted EPS:
As reported $1.45 $ 1.10 $ 1.03
Pro forma 1.40 1.06 0.97