CVS 2005 Annual Report Download - page 22
Download and view the complete annual report
Please find page 22 of the 2005 CVS annual report below. You can navigate through the pages in the report by either clicking on the pages listed below, or by using the keyword search tool below to find specific information within the annual report.-
 1
1 -
2
-
3
-
4
-
5
-
6
-
7
-
8
-
9
-
10
-
11
-
 12
12 -
 13
13 -
 14
14 -
 15
15 -
 16
16 -
 17
17 -
 18
18 -
 19
19 -
 20
20 -
 21
21 -
 22
22 -
 23
23 -
 24
24 -
 25
25 -
 26
26 -
 27
27 -
 28
28 -
 29
29 -
 30
30 -
 31
31 -
 32
32 -
33
-
34
-
35
-
36
-
37
-
38
-
39
-
40
-
41
-
42
-
43
-
44
-
45
-
46
-
47
-
48
-
49
-
50
-
51
-
52
 |
 |

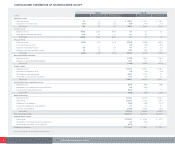
20 CVS CORPORATION 2005 ANNUAL REPORT
%During the fourth quarter of 2004, an assessment of tax reserves resulted in a reduction that was
principally based on finalizing certain tax return years and on a 2004 court decision that was relevant
to the industry. As a result, the Company reversed $60.0 million of previously recorded tax reserves
through the income tax provision.
%For internal comparisons, management finds it useful to assess year-to-year performance excluding the
impact of the tax benefit in 2005 and 2004 discussed above, and uses 38.6%, 38.5% and 38.4% as
comparable effective tax rates for 2005, 2004 and 2003, respectively.
NET EARNINGS increased $305.9 million or 33.3% to $1.2 billion (or $1.45 per diluted share) in 2005.
This compares to $918.8 million (or $1.10 per diluted share) in 2004, and $847.3 million (or $1.03 per diluted
share) in 2003. For internal comparisons, management finds it useful to assess year-to-year performance
excluding the $52.6 million tax reserve reversal discussed above, and uses $1.2 billion (or $1.39 per diluted
share) for comparable net earnings in 2005. In addition, management finds it useful to remove the $40.5
million after-tax effect of the $65.9 million Lease Adjustment to total operating expense and the $60.0 million
tax reserve reversal, discussed above, and uses $899.3 million (or $1.08 per diluted share) for its internal
comparisons in 2004.
Liquidity & Capital Resources
We anticipate that our cash flow from operations, supplemented by short-term commercial paper and
long-term borrowings, will continue to fund the future growth of our business.
NET CASH PROVIDED BY OPERATING ACTIVITIES increased to $1,612.1 million in 2005. This compares to
$914.2 million in 2004 and $968.9 million in 2003. The increase in net cash provided by operations during
2005 primarily resulted from increased revenues and improved inventory management. Fiscal 2004 reflected
increased inventory payments as a result of higher inventory levels, and higher operating costs associated
with the Acquired Businesses and investments, including the cost of extending store hours. The elevated
inventory levels during 2004 were primarily the result of inventory purchased to reset the acquired stores
with the CVS/pharmacy product mix.
NET CASH USED IN INVESTING ACTIVITIES decreased to $911.6 million in 2005. This compares to $3,163.3
million in 2004 and $753.6 million in 2003. The decrease in net cash used in investing activities during 2005
related to a decrease in acquisitions, as 2004 included the acquisition of the Acquired Businesses. Gross
capital expenditures totaled $1,495.4 million during 2005, compared to $1,347.7 million in 2004 and $1,121.7
million in 2003. During 2005, approximately 56% of our total capital expenditures were for new store
construction, 29% for store expansion and improvements and 15% for technology and other corporate
initiatives, including a new distribution center in Florida, which is expected to be completed during 2006.
During 2006, we currently plan to invest over $1.4 billion in gross capital expenditures, which will include
spending for approximately 250–275 new or relocated stores.
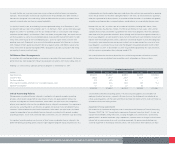
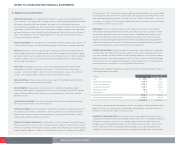
Following is a summary of our store development activity for the respective years:
2005 2004 2003
Total stores (beginning of year) 5,375 4,179 4,087
New and acquired stores 166 1,397 150
Closed stores (70) (201) (58)
Total stores (end of year) 5,471 5,375 4,179
Relocated stores(1) 131 96 125
(1) Relocated stores are not included in new or closed store totals.
NET CASH USED IN FINANCING ACTIVITIES was $579.4 million in 2005, compared to net cash provided
by financing activities of $1,798.2 million in 2004 and net cash used in financing activities of $72.5 million
in 2003. The increase in net cash used in financing activities during 2005 was primarily due to a reduction
in short-term borrowings. Fiscal 2004 reflected the financing of the acquisition of the Acquired Businesses,
including the issuance of the Notes (defined below) during the third quarter of 2004. The increase was
offset, in part, by the repayment of the $300 million, 5.5% unsecured senior notes, which matured during
the first quarter of 2004. During 2005, we paid common stock dividends totaling $117.5 million, or $0.145
per common share. In January 2006, our Board of Directors authorized a 7% increase in our common
stock dividend to $0.155 per share for 2006.
We believe that our current cash on hand and cash provided by operations, together with our ability to
obtain additional short-term and long-term financing, will be sufficient to cover our working capital needs,
capital expenditures, debt service and dividend requirements for at least the next several years.
We had $253.4 million of commercial paper outstanding at a weighted average interest rate of 3.3%
as of December 31, 2005. In connection with our commercial paper program, we maintain a $650 million,
five-year unsecured back-up credit facility, which expires on May 21, 2006, and a $675 million, five-year
unsecured back-up credit facility, which expires on June 2, 2010. In addition, we maintain a $675 million,
five-year unsecured back-up credit facility, which expires on June 11, 2009. The credit facilities allow for
borrowings at various rates that are dependent in part on our public debt rating. As of December 31, 2005,
we had no outstanding borrowings against the credit facilities.
On September 14, 2004, we issued $650 million of 4.0% unsecured senior notes due September 15, 2009,
and $550 million of 4.875% unsecured senior notes due September 15, 2014 (collectively the “Notes”).
The Notes pay interest semi-annually and may be redeemed at any time, in whole or in part at a defined
redemption price plus accrued interest. Net proceeds from the Notes were used to repay a portion of
the outstanding commercial paper issued to finance the acquisition of the Acquired Businesses. As of
December 31, 2005, we had no freestanding derivatives in place.