CVS 2005 Annual Report Download - page 30
Download and view the complete annual report
Please find page 30 of the 2005 CVS annual report below. You can navigate through the pages in the report by either clicking on the pages listed below, or by using the keyword search tool below to find specific information within the annual report.-
 1
1 -
2
-
3
-
4
-
5
-
6
-
7
-
8
-
9
-
10
-
11
-
12
-
13
-
14
-
15
-
16
-
17
-
18
-
19
-
 20
20 -
 21
21 -
 22
22 -
 23
23 -
 24
24 -
 25
25 -
 26
26 -
 27
27 -
 28
28 -
 29
29 -
 30
30 -
 31
31 -
 32
32 -
 33
33 -
 34
34 -
 35
35 -
 36
36 -
 37
37 -
 38
38 -
 39
39 -
 40
40 -
41
-
42
-
43
-
44
-
45
-
46
-
47
-
48
-
49
-
50
-
51
-
52
 |
 |

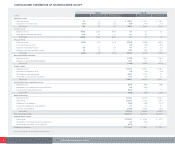
28
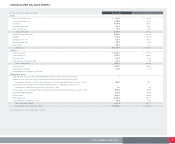
CONSOLIDATED STATEMENTS OF SHAREHOLDERS’ EQUITY
CVS CORPORATION 2005 ANNUAL REPORT
SHARES DOLLARS
In millions Dec. 31, 2005 Jan. 1, 2005 Jan. 3, 2004 Dec. 31, 2005 Jan. 1, 2005 Jan. 3, 2004
Preference stock:
Beginning of year 4.3 4.5 4.7 $228.4 $242.7 $250.4
Conversion to common stock (0.1) (0.2) (0.2) (5.8) (14.3) (7.7)
End of year 4.2 4.3 4.5 222.6 228.4 242.7
Common stock:
Beginning of year 828.6 820.4 818.6 8.3 8.2 8.2
Stock options exercised and awards 10.2 8.2 1.8 0.1 0.1 —
End of year 838.8 828.6 820.4 8.4 8.3 8.2
Treasury stock:
Beginning of year (26.6) (29.6) (32.4) (385.9) (428.6) (469.5)
Purchase of treasury shares —— — (1.7) (0.8) (0.5)
Conversion of preference stock 0.5 1.2 0.6 7.3 17.9 9.6
Employee stock purchase plan issuance 1.6 1.8 2.2 23.8 25.6 31.8
End of year (24.5) (26.6) (29.6) (356.5) (385.9) (428.6)
Guaranteed ESOP obligation:
Beginning of year (140.9) (163.2) (194.4)
Reduction of guaranteed ESOP obligation 26.9 22.3 31.2
End of year (114.0) (140.9) (163.2)
Capital surplus:
Beginning of year 1,687.3 1,553.1 1,542.5
Conversion of preference stock (1.5) (3.6) (1.9)
Stock option activity and awards 188.8 119.4 9.2
Tax benefit on stock options and awards 47.8 18.4 3.3
End of year 1,922.4 1,687.3 1,553.1
Accumulated other comprehensive loss:
Beginning of year (55.5) (36.9) (44.6)
Recognition of unrealized gain/(loss) on derivatives 2.9 (19.8) —
Minimum pension liability adjustment (37.7) 1.2 7.7
End of year (90.3) (55.5) (36.9)
Retained earnings:
Beginning of year 5,645.5 4,846.5 4,104.4
Net earnings 1,224.7 918.8 847.3
Preference stock dividends (16.2) (16.6) (17.7)
Tax benefit on preference stock dividends 2.1 2.4 3.1
Common stock dividends (117.5) (105.6) (90.6)
End of year 6,738.6 5,645.5 4,846.5
Total shareholders’ equity $ 8,331.2 $ 6,987.2 $ 6,021.8
Comprehensive income:
Net earnings $ 1,224.7 $918.8 $847.3
Recognition of unrealized gain/(loss) on derivatives 2.9 (19.8) —
Minimum pension liability, net of income tax (37.7) 1.2 7.7
Comprehensive income $ 1,189.9 $900.2 $855.0
See accompanying notes to consolidated financial statements.