CVS 2005 Annual Report Download - page 20
Download and view the complete annual report
Please find page 20 of the 2005 CVS annual report below. You can navigate through the pages in the report by either clicking on the pages listed below, or by using the keyword search tool below to find specific information within the annual report.-
 1
1 -
2
-
3
-
4
-
5
-
6
-
7
-
8
-
9
-
 10
10 -
 11
11 -
 12
12 -
 13
13 -
 14
14 -
 15
15 -
 16
16 -
 17
17 -
 18
18 -
 19
19 -
 20
20 -
 21
21 -
 22
22 -
 23
23 -
 24
24 -
 25
25 -
 26
26 -
 27
27 -
 28
28 -
 29
29 -
 30
30 -
31
-
32
-
33
-
34
-
35
-
36
-
37
-
38
-
39
-
40
-
41
-
42
-
43
-
44
-
45
-
46
-
47
-
48
-
49
-
50
-
51
-
52
 |
 |

18
MANAGEMENT’S DISCUSSION AND ANALYSIS OF FINANCIAL CONDITION AND RESULTS OF OPERATIONS
CVS CORPORATION 2005 ANNUAL REPORT
The following discussion should be read in conjunction with our audited consolidated financial statements and our Cautionary
Statement Concerning Forward-Looking Statements that are presented in this Annual Report.
Our Business
Our Company is a leader in the retail drugstore industry in the United States. We sell prescription drugs
and a wide assortment of general merchandise, including over-the-counter drugs, beauty products and
cosmetics, film and photofinishing services, seasonal merchandise, greeting cards and convenience foods
through our CVS/pharmacy®retail stores and online through CVS.com.
®We also provide pharmacy benefit
management, mail order services and specialty pharmacy services through PharmaCare Management
Services and PharmaCare Pharmacy®stores. As of December 31, 2005, we operated 5,471 retail and
specialty pharmacy stores in 37 states and the District of Columbia.
Recent Development
On January 22, 2006, we entered into a definitive agreement under which we will acquire approximately
700 standalone Sav-on and Osco drugstores, as well as a distribution center located in La Habra,
California, from Albertson’s, Inc. (“Albertson’s”), for $2.93 billion in cash immediately preceding the planned
merger of Albertson’s and Supervalu, Inc. (“Supervalu”). Approximately half of the drugstores are located
in southern California, with others in our existing markets in numerous states across the Midwest and
Southwest. We will also acquire Albertson’s owned real estate interests in the drugstores for $1.0 billion
in cash. Closing of the transaction, which is expected to occur in mid-2006, is subject to review under the
Hart-Scott-Rodino Act, as well as other customary closing conditions. Further, closing is also conditioned
on consummation of the merger between Albertson’s and Supervalu, which is also subject to review under
the Hart-Scott-Rodino Act and other customary closing conditions, as well as approval by the shareholders
of Albertson’s and Supervalu. We expect to finance the transaction through a combination of cash, short-
term and long-term debt and proceeds from the subsequent sale-leaseback of the owned real estate
interests. Closing of the transaction is not subject to such financing.
Acquired Business
On July 31, 2004, the Company acquired certain assets and assumed certain liabilities from J.C. Penney
Company, Inc. and certain of its subsidiaries, including Eckerd Corporation (“Eckerd”). The acquisition
included more than 1,200 Eckerd retail drugstores and Eckerd Health Services, which included Eckerd’s
mail order and pharmacy benefit management businesses (collectively, the “Acquired Businesses”). The
Company believes that the acquisition of the Acquired Businesses is consistent with its long-term strategy
of expanding its retail drugstore business in high-growth markets and increasing the size and product
offerings of its pharmacy benefit management business. Please see Note 2 to the consolidated financial
statements for additional information.
Results of Operations and Industry Analysis
The Company’s fiscal year is a 52 or 53 week period ending on the Saturday closest to December 31.
Fiscal 2005, which ended on December 31, 2005 and fiscal 2004, which ended on January 1, 2005,
each included 52 weeks. Fiscal 2003, which ended on January 3, 2004, included 53 weeks. Unless
otherwise noted, all references to 2005, 2004 and 2003 relate to these fiscal years.
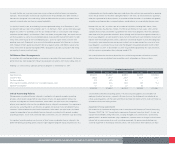
NET SALES–The following table summarizes our sales performance:
2005 2004 2003
Net sales (in billions) $ 37.0 $ 30.6 $ 26.6
Net sales increase:
Total 21.0% 15.1% 10.0%
Pharmacy 22.0% 17.1% 11.9%
Front store 18.4%10.5% 5.7%
Same store sales increase:
Total 6.5% 5.5% 5.8%
Pharmacy 7.0% 7.0% 8.1%
Front store 5.5% 2.3% 1.2%
Pharmacy % of total sales 70.2% 70.0% 68.8%
Third party % of pharmacy sales 94.1% 94.1% 93.2%
Prescriptions filled (in millions) 434 366 335
As you review our net sales performance, we believe you should consider the following important information:
%Total net sales were significantly affected by the July 31, 2004 acquisition of the Acquired Businesses.
Excluding the sales from the Acquired Businesses, total sales increased approximately 8.4% and
5.2% during 2005 and 2004, respectively. Beginning in August 2005, same store sales include the
acquired stores, which increased total same store sales by approximately 60 basis points in 2005.
%Total net sales from new stores accounted for approximately 160 basis points of our total net sales
percentage increase in 2005, and 190 basis points in 2004.
%Total net sales continued to benefit from our ongoing relocation program, which moves existing
in-line shopping center stores to larger, more convenient, freestanding locations. Historically, we have
achieved significant improvements in customer count and net sales when we do this. Although the
number of annual relocations has decreased, our relocation strategy remains an important component
of our overall growth strategy. As of December 31, 2005, approximately 59% of our existing stores were
freestanding, compared to approximately 55% at January 1, 2005.
%The increase in total net sales in 2004 was negatively affected by the 53rd week in 2003, which
generated $530.8 million in net sales.
%Pharmacy sales growth continued to benefit from new market expansions, increased penetration
in existing markets, our ability to attract and retain managed care customers and favorable industry
trends. These trends include an aging American population; many “baby boomers” are now in their
fifties and are consuming a greater number of prescription drugs. The increased use of pharmaceuticals
as the first line of defense for individual healthcare also contributed to the growing demand for
pharmacy services. We believe these favorable industry trends will continue.
%Pharmacy sales were negatively impacted in all years by the conversion of brand named drugs to
equivalent generic drugs, which typically have a lower selling price. However, our gross margins on
generic drug sales are generally higher than our gross margins on equivalent brand named drug sales.