CVS 2002 Annual Report Download - page 42
Download and view the complete annual report
Please find page 42 of the 2002 CVS annual report below. You can navigate through the pages in the report by either clicking on the pages listed below, or by using the keyword search tool below to find specific information within the annual report.-
 1
1 -
2
-
3
-
4
-
5
-
6
-
7
-
8
-
9
-
10
-
11
-
12
-
13
-
14
-
15
-
16
-
17
-
18
-
19
-
20
-
21
-
22
-
23
-
24
-
25
-
26
-
27
-
28
-
29
-
30
-
31
-
 32
32 -
 33
33 -
 34
34 -
 35
35 -
 36
36 -
 37
37 -
 38
38 -
 39
39 -
 40
40 -
 41
41 -
 42
42 -
 43
43 -
 44
44
 |
 |
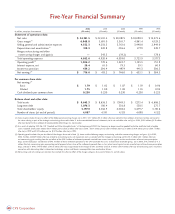
40 CVS Corporation
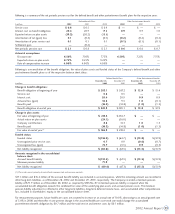
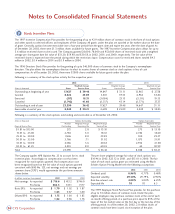
Five-Year Financial Summary
2002 2001 2000 1999 1998
In millions, except per share amounts (52 weeks) (52 weeks) (52 weeks) (53 weeks) (52 weeks)
Statement of operations data:
Net sales $ 24,181.5 $ 22,241.4 $ 20,087.5 $ 18,098.3 $ 15,273.6
Gross margin(1) 6,068.8 5,691.0 5,361.7 4,861.4 4,129.2
Selling, general and administrative expenses 4,552.3 4,256.3 3,761.6 3,448.0 2,949.0
Depreciation and amortization(2) 310.3 320.8 296.6 277.9 249.7
Merger, restructuring and other
nonrecurring charges and (gains) —343.3 (19.2) — 178.6
Total operating expenses 4,862.6 4,920.4 4,039.0 3,725.9 3,377.3
Operating profit(3) 1,206.2 770.6 1,322.7 1,135.5 751.9
Interest expense, net 50.4 61.0 79.3 59.1 60.9
Income tax provision 439.2 296.4 497.4 441.3 306.5
Net earnings(4) $716.6 $ 413.2 $ 746.0 $ 635.1 $ 384.5
Per common share data:
Net earnings(4)
Basic $1.79$ 1.02 $ 1.87 $ 1.59 $ 0.96
Diluted 1.75 1.00 1.83 1.55 0.95
Cash dividends per common share 0.230 0.230 0.230 0.230 0.225
Balance sheet and other data:
Total assets $ 9,645.3 $ 8,636.3 $ 7,949.5 $ 7,275.4 $ 6,686.2
Long-term debt 1,076.3 810.4 536.8 558.5 275.7
Total shareholders’ equity 5,197.0 4,566.9 4,304.6 3,679.7 3,110.6
Number of stores (at end of period) 4,087 4,191 4,133 4,098 4,122
(1) Gross margin includes the pre-tax effect of the following nonrecurring charges: (i) in 2001, $5.7 million ($3.6 million after-tax) related to the markdown of certain inventory contained in
the stores closing as part of the strategic restructuring, discussed in Note 11 to the consolidated financial statements, to its net realizable value and (ii) in 1998, $10.0 million ($5.9 million
after-tax) related to the markdown of noncompatible Arbor Drugs, Inc. merchandise.
(2) As a result of adopting SFAS No. 142 “Goodwill and Other Intangible Assets” at the beginning of 2002, the Company no longer amortizes goodwill and other indefinite-lived intangible
assets. Goodwill amortization totaled $31.4 million pre-tax ($28.2 million after-tax) in 2001, $33.7 million pre-tax ($31.9 million after-tax) in 2000, $38.9 million pre-tax ($38.1 million
after-tax) in 1999 and $37.4 million pre-tax ($37.2 million after-tax) in 1998.
(3) Operating profit includes the pre-tax effect of the charges discussed in Note (1) above and the following merger, restructuring, and other nonrecurring charges and gains: (i) in 2001,
$346.8 million ($226.9 million after-tax) related to restructuring and asset impairment costs associated with the strategic restructuring and the $3.5 million ($2.1 million after-tax)
net nonrecurring gain resulting from the net effect of the $50.3 million of settlement proceeds received from various lawsuits against certain manufacturers of brand name prescription
drugs and the Company’s contribution of $46.8 million of these settlement proceeds to the CVS Charitable Trust, Inc. to fund future charitable giving, (ii) in 2000, $19.2 million ($11.5
million after-tax) nonrecurring gain representing partial payment of our share of the settlement proceeds from a class action lawsuit against certain manufacturers of brand name prescription
drugs, and (iii) in 1998, $147.3 million ($101.3 million after-tax) charge related to the merger of CVS and Arbor and $31.3 million ($18.4 million after-tax) of nonrecurring costs incurred in
connection with eliminating Arbor’s information technology systems and Revco’s noncompatible store merchandise fixtures.
(4) Net earnings and net earnings per common share include the after-tax effect of the charges and gains discussed in Notes (1) and (3) above.