CVS 2002 Annual Report Download - page 3
Download and view the complete annual report
Please find page 3 of the 2002 CVS annual report below. You can navigate through the pages in the report by either clicking on the pages listed below, or by using the keyword search tool below to find specific information within the annual report.-
 1
1 -
 2
2 -
 3
3 -
 4
4 -
 5
5 -
 6
6 -
 7
7 -
 8
8 -
 9
9 -
 10
10 -
 11
11 -
 12
12 -
 13
13 -
 14
14 -
15
-
16
-
17
-
18
-
19
-
20
-
21
-
22
-
23
-
24
-
25
-
26
-
27
-
28
-
29
-
30
-
31
-
32
-
33
-
34
-
35
-
36
-
37
-
38
-
39
-
40
-
41
-
42
-
43
-
44
 |
 |

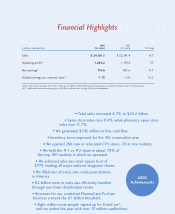
2002 2001
In millions, except per share (52 weeks) (52 weeks) % Change
Sales $ 24,181.5 $ 22,241.4 8.7
Operating profit* 1,206.2 1,119.6 7.7
Net earnings* 716.6 641.6 11.7
Diluted earnings per common share* 1.75 1.56 12.2
*2001 results exclude the impact of a $352.5 million pre-tax ($230.5 million after-tax) restructuring and asset impairment charge and a $3.5 million pre-tax
($2.1 million after-tax) net nonrecurring gain, or $0.56 per diluted share. See page 40 for further information.
Financial Highlights
• Total sales increased 8.7% to $24.2 billion.
• Same store sales rose 8.4%, while pharmacy same store
sales rose 11.7%.
• We generated $545 million in free cash flow.
• Inventory turns improved for the 4th consecutive year.
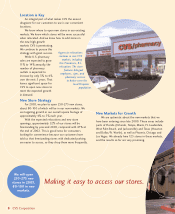
• We opened 266 new or relocated CVS stores, 78 in new markets.
• We held the #1 or #2 share in about 70% of
the top 100 markets in which we operated.
• We achieved sales per retail square foot of
$770, leading all major national drugstore chains.
• We filled one of every nine retail prescriptions
in America.
• $2 billion more in sales was efficiently handled
through one fewer distribution center.
• Revenues for our combined PharmaCare/ProCare
business crossed the $1 billion threshold.
• Eight million more people signed up for ExtraCare®,
and we ended the year with over 33 million cardholders.
2002
Achievements