CVS 2002 Annual Report Download - page 41
Download and view the complete annual report
Please find page 41 of the 2002 CVS annual report below. You can navigate through the pages in the report by either clicking on the pages listed below, or by using the keyword search tool below to find specific information within the annual report.-
 1
1 -
2
-
3
-
4
-
5
-
6
-
7
-
8
-
9
-
10
-
11
-
12
-
13
-
14
-
15
-
16
-
17
-
18
-
19
-
20
-
21
-
22
-
23
-
24
-
25
-
26
-
27
-
28
-
29
-
30
-
 31
31 -
 32
32 -
 33
33 -
 34
34 -
 35
35 -
 36
36 -
 37
37 -
 38
38 -
 39
39 -
 40
40 -
 41
41 -
 42
42 -
 43
43 -
 44
44
 |
 |

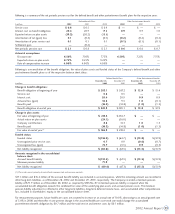
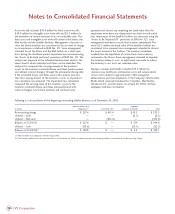
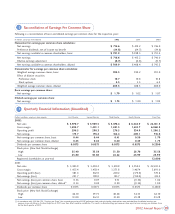
Reconciliation of Earnings Per Common Share
Following is a reconciliation of basic and diluted earnings per common share for the respective years:
In millions, except per share amounts 2002 2001 2000
Numerator for earnings per common share calculation:
Net earnings $716.6 $ 413.2 $ 746.0
Preference dividends, net of income tax benefit (14.8) (14.7) (14.6)
Net earnings available to common shareholders, basic $701.8 $ 398.5 $ 731.4
Net earnings $716.6 $ 413.2 $ 746.0
Dilutive earnings adjustment (6.7) (4.8) (0.7)
Net earnings available to common shareholders, diluted $ 709.9 $ 408.4 $ 745.3
Denominator for earnings per common share calculation:
Weighted average common shares, basic 392.3 392.2 391.0
Effect of dilutive securities:
Preference stock 10.7 10 . 8 10 . 8
Stock options 2.3 5.3 6.2
Weighted average common shares, diluted 405.3 408.3 408.0
Basic earnings per common share:
Net earnings $1.79 $1.02 $1.87
Diluted earnings per common share:
Net earnings $1.75 $1.00 $ 1.83
Dollars in millions, except per share amounts First Quarter Second Quarter Third Quarter Fourth Quarter Fiscal Year
2002:
Net sales $ 5,970.7 $ 5,989.5 $ 5,876.4 $ 6,344.9 $ 24,181.5
Gross margin 1,493.7 1,481.1 1,481.3 1,612.7 6,068.8
Operating profit 296.5 298.3 276.5 334.9 1,206.2
Net earnings 175.7 176.4 164.4 200.1 716.6
Net earnings per common share, basic 0.44 0.44 0.41 0.50 1.79
Net earnings per common share, diluted 0.43 0.43 0.40 0.49 1.75
Dividends per common share 0.0575 0.0575 0.0575 0.0575 0.2300
Stock price: (New York Stock Exchange)
High 35.40 35.58 31.30 28.70 35.58
Low 25.80 30.60 24.42 23.99 23.99
Registered shareholders at year-end 12,000
2001:
Net sales $ 5,385.9 $ 5,494.2 $ 5,410.8 $ 5,950.5 $ 22,241.4
Gross margin 1,453.4 1,458.4 1,371.8 1,407.4 5,691.0
Operating profit (loss) 381.4 342.0 220.2 (173.0) 770.6
Net earnings (loss) 221.7 198.0 123.7 (130.2) 413.2
Net earnings (loss) per common share, basic 0.56 0.49 0.31 (0.34) 1.02
Net earnings (loss) per common share, diluted(1) 0.54 0.48 0.30 (0.34) 1.00
Dividends per common share 0.0575 0.0575 0.0575 0.0575 0.2300
Stock price: (New York Stock Exchange)
High 62.10 59.75 40.48 34.55 62.10
Low 51.00 36.51 31.40 23.28 23.28
(1) In accordance with SFAS No. 128, “Earnings per Share”, the assumed conversion of ESOP preference stock and outstanding stock options were excluded from the diluted earnings per
common share calculation in the fourth quarter of 2001 since their effect would be antidilutive. This results in diluted earnings per common share equal to basic earnings per common share
for the fourth quarter of 2001.
39
2002 Annual Report
12
Quarterly Financial Information (Unaudited)
13