CVS 2002 Annual Report Download - page 36
Download and view the complete annual report
Please find page 36 of the 2002 CVS annual report below. You can navigate through the pages in the report by either clicking on the pages listed below, or by using the keyword search tool below to find specific information within the annual report.-
 1
1 -
2
-
3
-
4
-
5
-
6
-
7
-
8
-
9
-
10
-
11
-
12
-
13
-
14
-
15
-
16
-
17
-
18
-
19
-
20
-
21
-
22
-
23
-
24
-
25
-
 26
26 -
 27
27 -
 28
28 -
 29
29 -
 30
30 -
 31
31 -
 32
32 -
 33
33 -
 34
34 -
 35
35 -
 36
36 -
 37
37 -
 38
38 -
 39
39 -
 40
40 -
 41
41 -
 42
42 -
 43
43 -
 44
44
 |
 |

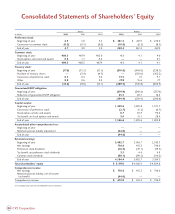
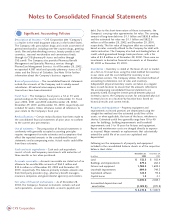
Notes to Consolidated Financial Statements
Stock Incentive Plans
The 1997 Incentive Compensation Plan provides for the granting of up to 42.9 million shares of common stock in the form of stock options
and other awards to selected officers and employees of the Company. All grants under the plan are awarded at fair market value on the date
of grant. Generally, options become exercisable over a four-year period from the grant date and expire ten years after the date of grant. As
of December 28, 2002, there were 21.3 million shares available for future grants. The 1997 Incentive Compensation plans allows for up to
3.6 million restricted shares to be issued. The Company granted 26,000, 76,000 and 952,000 shares of restricted stock with a weighted
average per share grant date fair value of $31.20, $59.98 and $30.58, in 2002, 2001, and 2000, respectively. The fair value of the
restricted shares is expensed over the period during which the restrictions lapse. Compensation costs for restricted shares totaled $4.3
million in 2002, $5.4 million in 2001 and $5.9 million in 2000.
The 1996 Directors Stock Plan provides for the granting of up to 346,000 shares of common stock to the Company’s nonemployee
directors. The plan allows the nonemployee directors to elect to receive shares of common stock or stock options in lieu of cash
compensation. As of December 28, 2002, there were 37,000 shares available for future grants under the plan.
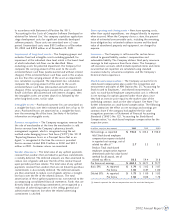
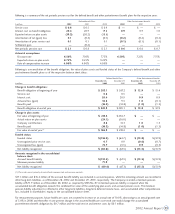
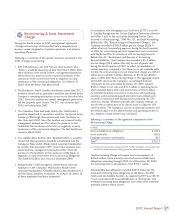
The Company applies APB Opinion No. 25 to account for its stock
incentive plans. Accordingly, no compensation cost has been
recognized for stock options granted. Had compensation cost
been recognized based on the fair value of stock options granted
consistent with SFAS No. 123, net earnings and net earnings per
common share (“EPS”) would approximate the pro forma amounts
shown below:
The per share weighted-average fair value of stock options was
$10.46 in 2002, $25.12 in 2001, and $13.01 in 2000. The fair
value of each stock option grant was estimated using the Black-
Scholes Option Pricing Model with the following assumptions:
The 1999 Employee Stock Purchase Plan provides for the purchase
of up to 7.4 million shares of common stock. Under the plan,
eligible employees may purchase common stock at the end of each
six-month offering period, at a purchase price equal to 85% of the
lower of the fair market value on the first day or the last day of the
offering period. As of December 28, 2002, 2.8 million shares of
common stock have been issued since inception of the plan.
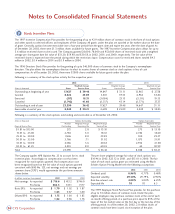
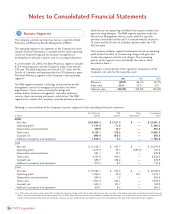
Following is a summary of the stock option activity for the respective years:
2002 2001 2000
Weighted Average Weighted Average Weighted Average
Shares in thousands Shares Exercise Price Shares Exercise Price Shares Exercise Price
Outstanding at beginning of year 17, 627 $ 39 . 4 8 14,647 $ 31.11 12,965 $ 27.38
Granted 8,022 29.89 5,381 59.55 6,964 33.84
Exercised (517) 18.31 (1,084) 23.13 (3,511) 19.55
Canceled (1,742) 41.66 (1,317) 43.14 (1,771) 37.37
Outstanding at end of year 23,390 36.42 17,627 39.48 14,647 31.11
Exercisable at end of year 8,048 $ 30.21 4,609 $ 25.09 4,049 $ 18.85
Following is a summary of the stock options outstanding and exercisable as of December 28, 2002:
Shares in thousands Options Outstanding Options Exercisable
Number Weighted Average Weighted Average Number Weighted Average
Range of Exercise Prices Outstanding Remaining Life Exercise Price Exercisable Exercise Price
$1.81 to $15.00 275 2.8 $ 13.10 275 $ 13.10
15.01 to 25.00 2,784 3.0 18.61 2,782 18.60
25.01 to 30.00 7,646 8.8 29.83 100 29.27
30.01 to 35.00 3,766 7.1 31.92 1,875 31.91
35.01 to 50.00 4,586 5.6 40.63 2,952 41.08
50.01 to 61.23 4,333 8.0 60.45 64 58.99
Total 23,390 7.0 $ 36.42 8,048 $ 30.21
In millions, except per share amounts 2002 2001 2000
Net earnings: As reported $716.6 $ 413.2 $746.0
Pro forma 662.5 357.1 717.7
Basic EPS: As reported $1.79 $1.02 $1.87
Pro forma 1.65 0.87 1.80
Diluted EPS: As reported $1.75 $1.00 $1.83
Pro forma 1.62 0.86 1.76
2002 2001 2000
Dividend yield 0.96% 0.77% 0.40%
Expected volatility 29.50% 29.79% 27.92%
Risk-free interest rate 4.00% 5.00% 6.25%
Expected life 7. 0 7. 0 6 . 5
34 CVS Corporation
7