CVS 2002 Annual Report Download - page 35
Download and view the complete annual report
Please find page 35 of the 2002 CVS annual report below. You can navigate through the pages in the report by either clicking on the pages listed below, or by using the keyword search tool below to find specific information within the annual report.-
 1
1 -
2
-
3
-
4
-
5
-
6
-
7
-
8
-
9
-
10
-
11
-
12
-
13
-
14
-
15
-
16
-
17
-
18
-
19
-
20
-
21
-
22
-
23
-
24
-
 25
25 -
 26
26 -
 27
27 -
 28
28 -
 29
29 -
 30
30 -
 31
31 -
 32
32 -
 33
33 -
 34
34 -
 35
35 -
 36
36 -
 37
37 -
 38
38 -
 39
39 -
 40
40 -
 41
41 -
 42
42 -
 43
43 -
 44
44
 |
 |

33
2002 Annual Report
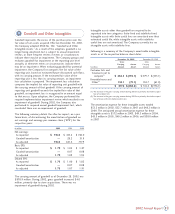
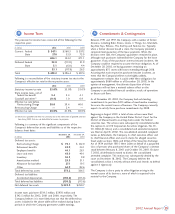
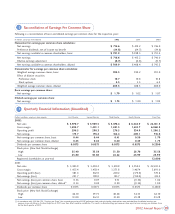
Following is a summary of the net periodic pension cost for the defined benefit and other postretirement benefit plans for the respective years:
Defined Benefit Plans Other Postretirement Benefits
In millions 2002 2001 2000 2002 2001 2000
Service cost $0.8 $ 0.5 $ 0.9 $— $— $—
Interest cost on benefit obligation 20.4 20.9 19.8 0.9 0.9 1.0
Expected return on plan assets (19.3) (20.2) (18.6) ———
Amortization of net (gain) loss 0.1 (0.3) (0.1) (0.2) (0.2) (0.2)
Amortization of prior service cost 0.1 0.1 0.1 (0.1) (0.1) (0.1)
Settlement gain —(0.2) — ———
Net periodic pension cost $2.1 $ 0.8 $ 2.1 $0.6 $ 0.6 $ 0.7
Actuarial assumptions:
Discount rate 6.50% 7. 5 0 % 7. 7 5 % 6.50% 7. 25 % 7. 75 %
Expected return on plan assets 8.75% 9.25% 9.25% ———
Rate of compensation increase 4.00% 4.00% 4.00% ———
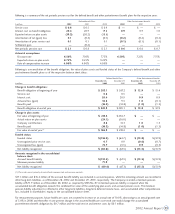
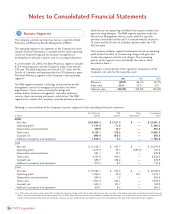
Following is a reconciliation of the benefit obligation, fair value of plan assets and funded status of the Company’s defined benefit and other
postretirement benefit plans as of the respective balance sheet dates:
Defined Benefit Plans Other Postretirement Benefits
December 28, December 29, December 28, December 29,
In millions 2002 2001 2002 2001
Change in benefit obligation:
Benefit obligation at beginning of year $283.1 $ 267.2 $12.9 $13.4
Service cost 0.8 0.5 ——
Interest cost 20.4 20.9 0.9 0.9
Actuarial loss (gain) 34.8 9.3 1.0 (0.1)
Benefits paid (16.3) (14.8) (1.0) (1.3)
Benefit obligation at end of year $322.8 $283.1 $13.8 $12.9
Change in plan assets:
Fair value at beginning of year $218.4 $234.7 $— $—
Actual return on plan assets (24.1) (16.0) ——
Company contributions 8.8 14 . 5 1.0 1.3
Benefits paid (16.3) (14.8) (1.0) (1.3)
Fair value at end of year(1) $186.8 $218.4 $— $—
Funded status:
Funded status $(136.0) $(64.7) $(13.8) $(12.9)
Unrecognized prior service cost 0.7 0.9 (0.6) (0.7)
Unrecognized loss (gain) 74. 7 (3.5) 0.9 (0.3)
Net liability recognized $ (60.6) $(67.3) $(13.5) $(13.9)
Amounts recognized in the consolidated
balance sheet:
Accrued benefit liability $(132.5) $(67.3) $(13.5) $(13.9)
Minimum pension liability 71.9 ———
Net liability recognized $ (60.6) $(67.3) $(13.5) $(13.9)
(1) Plan assets consist primarily of mutual funds, common stock and insurance contracts.
$17.1 million and $16.4 million of the accrued benefit liability was included in accrued expenses, while the remaining amount was recorded in
other long-term liabilities, as of December 28, 2002 and December 29, 2001, respectively. The Company recorded a minimum pension
liability of $71.9 million as of December 28, 2002, as required by SFAS No. 87. A minimum pension liability is required when the
accumulated benefit obligation exceeds the combined fair value of the underlying plan assets and accrued pension costs. The minimum
pension liability adjustment is reflected in other long-term liabilities, long-term deferred income taxes, and accumulated other comprehensive
loss, included in shareholders’ equity, in the consolidated balance sheet.
For measurement purposes, future healthcare costs are assumed to increase at an annual rate of 10.0%, decreasing to an annual growth rate
of 5.0% in 2008 and thereafter. A one percent change in the assumed healthcare cost trend rate would change the accumulated
postretirement benefit obligation by $0.7 million and the total service and interest costs by $0.1 million.